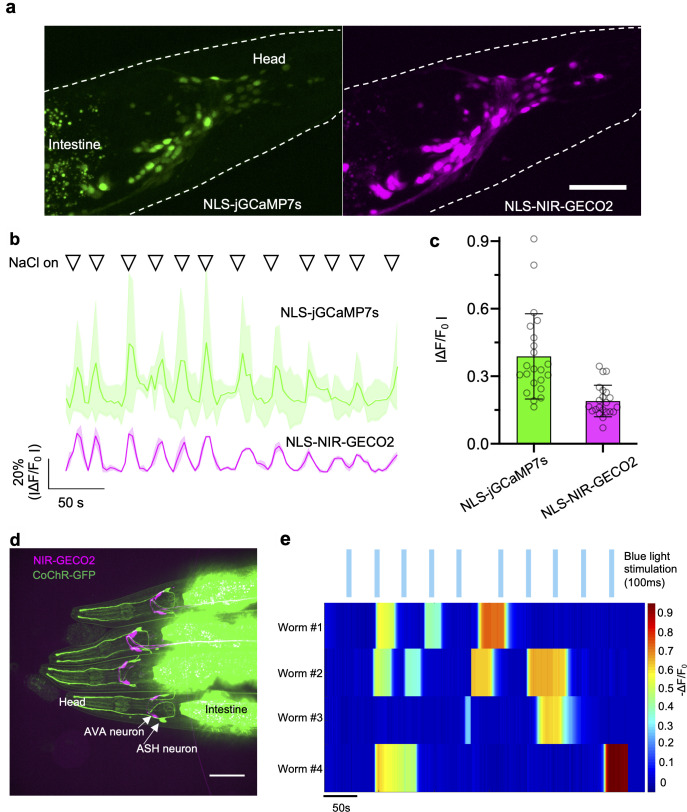
Fig 3. Imaging of NIR-GECO2 in response to microfluidic and optogenetic stimulation in C. elegans in vivo.
(a) Left, fluorescent image of neurons expressing NLS-jGCaMP7s (λex = 488-nm laser light, λem = 527/50 nm). Right, fluorescent image of neurons expressing NIR-GECO2-T2A-HO1 (λex = 640-nm laser light, λem = 685/40 nm). Representative of more than 3 worms, both under tag-168 promoter. Scale bar, 50 μm. (b) Fluorescence traces of NLS-jGCaMP7s (top) and NLS-NIR-GECO2 (bottom) in response to the stimulation of microfluidic containing 200 mM NaCl. Solid lines represent averaged data from 3 neurons. Shaded areas are shown as SD. Triangles on the top of the traces indicate the time points of stimulation (20 seconds for each stimulation). (c) Quantitative fluorescence changes of NLS-jGCaMP7s and NLS-NIR-GECO2 in b (n = 36 spikes from 3 neurons). (d) Fluorescence image of the 4 C. elegans expressing NIR-GECO2-T2A-HO1 in AVA neurons (under flp-18 promoter) and CoChR-GFP in ASH neurons (under sra-6 promoter). The merged image is shown. Imaging conditions: NIR-GECO2, λex = 640-nm laser light, λem = 685/40; GFP, λex = 488-nm laser light, λex = 527/50 nm. (e) Individual traces of NIR-GECO2 fluorescence in an AVA neuron under blue light illumination (20 mW/mm2, λex = 488-nm laser light, 100 ms; blue bars). The underlying data for b, c, and e can be found in S1 Data. NIR, near-infrared; SD, standard deviation.

