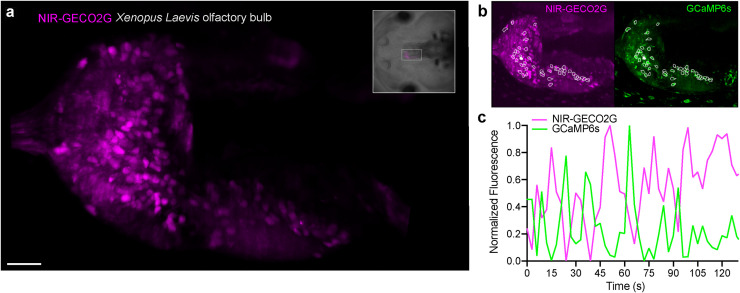
Fig 5. Spontaneous Ca2+ response imaging with NIR-GECO2G in the olfactory bulb of Xenopus laevis.
(a) Light-sheet acquisition of spontaneous Ca2+ response in the olfactory bulb in an intact animal. The image shows an intensity projection over 200 frames and a volume spanning 45 μm. The orientation and position of the field of view is marked in the brightfield image of the animal (upper right frame). Scale bar, 40 μm. (b) White frames indicate the cells that showed Ca2+ response with the NIR-GECO2G (magenta) and GCaMP6s (green) indicator. (c) A representative fluorescence response trace of spontaneous activity of 1 cell in the olfactory bulb (solid white ROI in b) is plotted over time. The intensity responses of NIR-GECO2G and GCaMP6s are antagonal to each other. Z-series volumes were acquired once every 3.0 seconds. NIR, near-infrared; ROI, region of interest.

