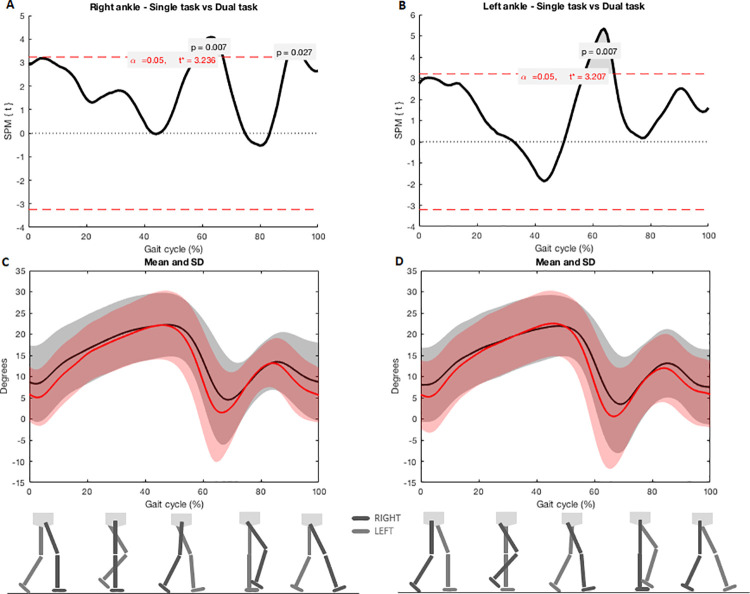
Fig 3.
A e B) SPM analysis of ankle angles (right and left) during single and dual-task gait. Gray zones indicate the exact moment of the gait cycle in which angles differ; C and D) Joint angles during the entire cycle of gait. Black lines indicate angles during the dual-task gait and red lines indicate single task gait. Shaded areas represent the standard deviation.

