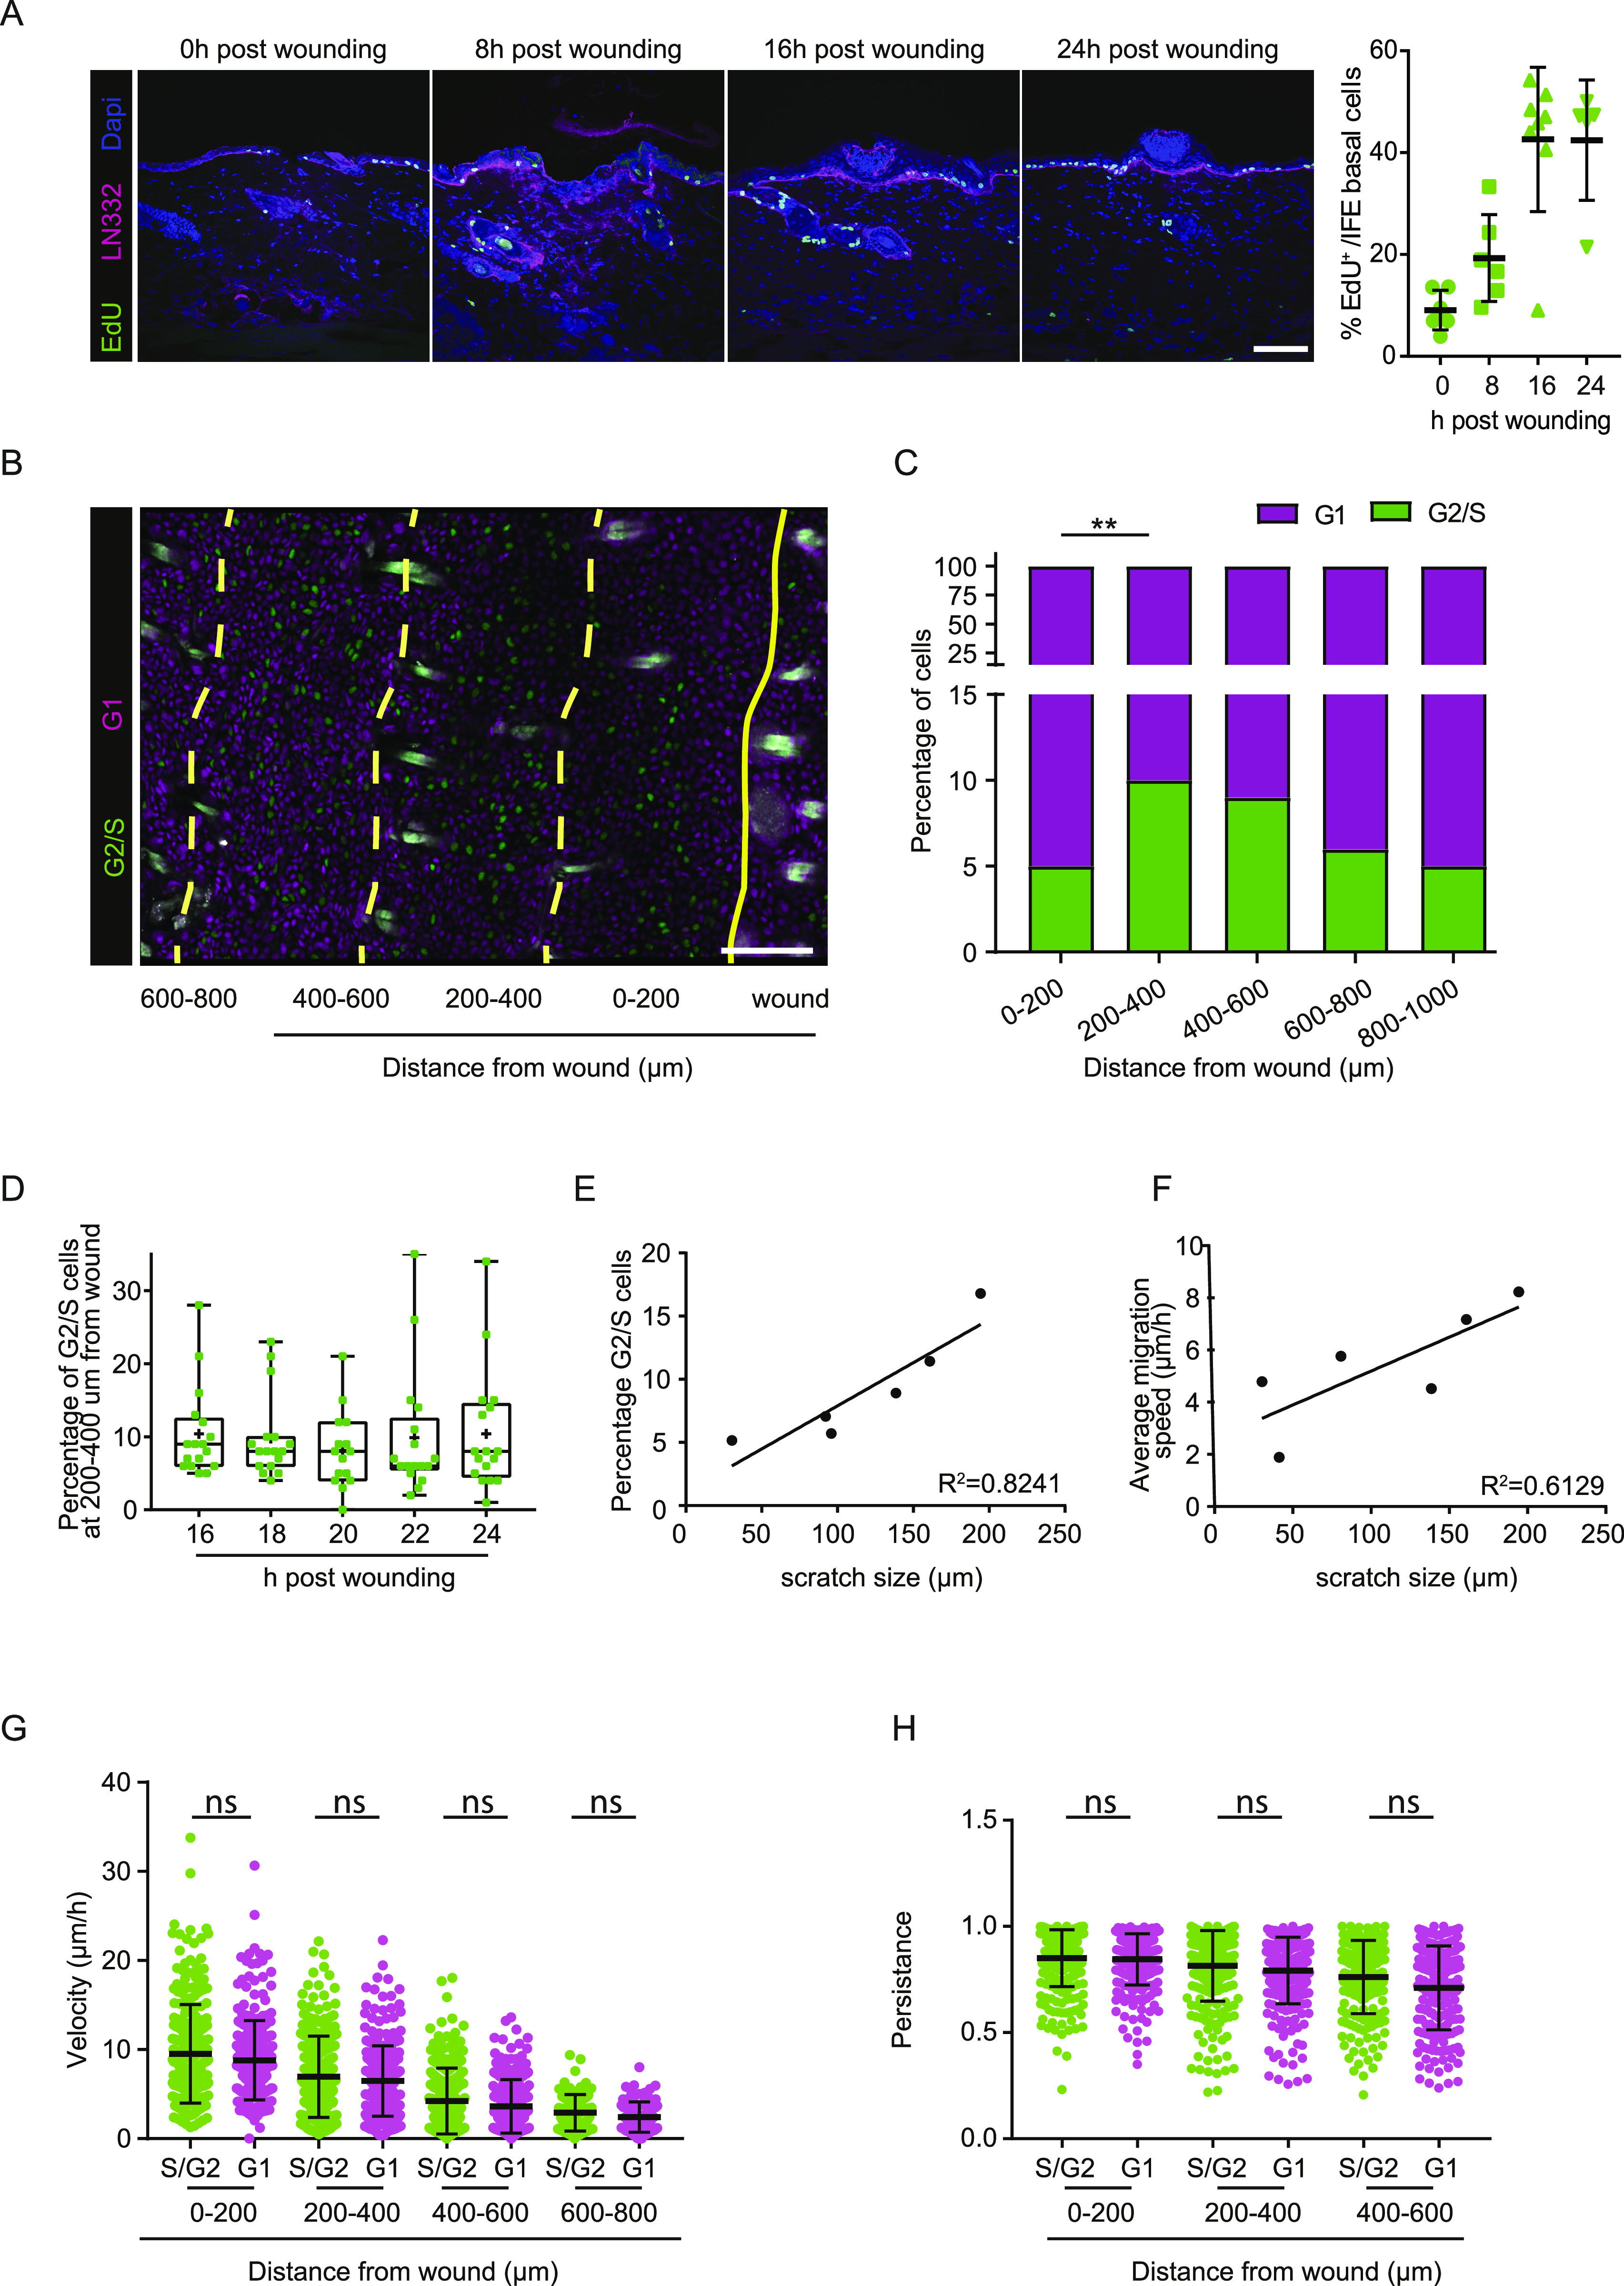
Figure 5. Proliferation occurs in a distinct zone and does not affect overall migration.
(A) Left panel: fluorescence staining of EdU incorporation (green) immediately after wounding and 8, 16 and 24 h post wounding. LN332 (magenta) immunofluorescence counterstain marks the basement membrane. Scale bar 100 μm. Right panel: quantification of EdU incorporation, each dot represents one wound in n = 2 mice. (B) Representative image of a scratch wound in Fucci2 mice. Cells in G1-phase (magenta), in G2/S-phase (green) in their different distances towards the wound. Scale bar 100 μm. (C) Quantification of percentage of proliferating (G2/S, green) and non-proliferating cells (G1, magenta) grouped based on their distance to the wound (0–200, 200–400, 400–600, 600–800, and 800–1,000 μm). **P = 0.0086 (ANOVA multiple comparison). (D) Percentage of proliferating G2/S cells within a distance of 200–400 μm away from the wound bed is plotted between 16 and 24 h post wounding. Plots depict the min., max., and median, the lower and upper quantile, the plus indicates the mean. (E) Linear regression analysis between scratch size (μm) and percentage of G2/S-phase proliferating cells 200–600 μm away from the wound site. R2 = 0.8241. (F) Linear regression analysis between scratch size (μm) and average migration velocity (μm/h) of basal keratinocytes 0–200 μm away from the wound site. R2 = 0.6129. (G) Quantification of migration velocity of proliferating S/G2-phase cells (green) and non-proliferating G1-phase cells (magenta) within different distances towards the wound. ns, not significant (unpaired t test). (H) Quantification of persistence of migratory proliferating S/G2-phase cells (green) and non-proliferating G1-phase cells (magenta) within different distances towards the wound. ns, not significant (Kruskal–Wallis test).
Source data are available for this figure.

