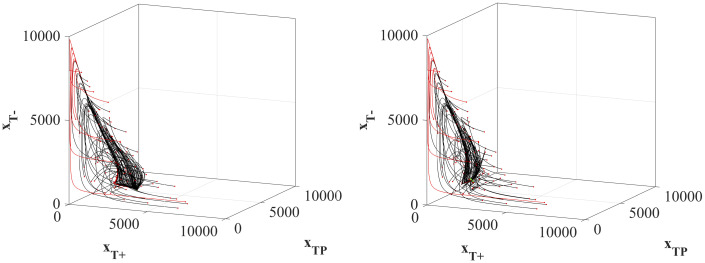
Fig 4. System state trajectories under optimal dose schedules.
State trajectories from each of the 100 initial tumor compositions to the two species equilibrium point (left panel) and the three-species equilibrium point (right panel). Paths highlighted in red breach the patient viability constraint before reaching the equilibrium point.

