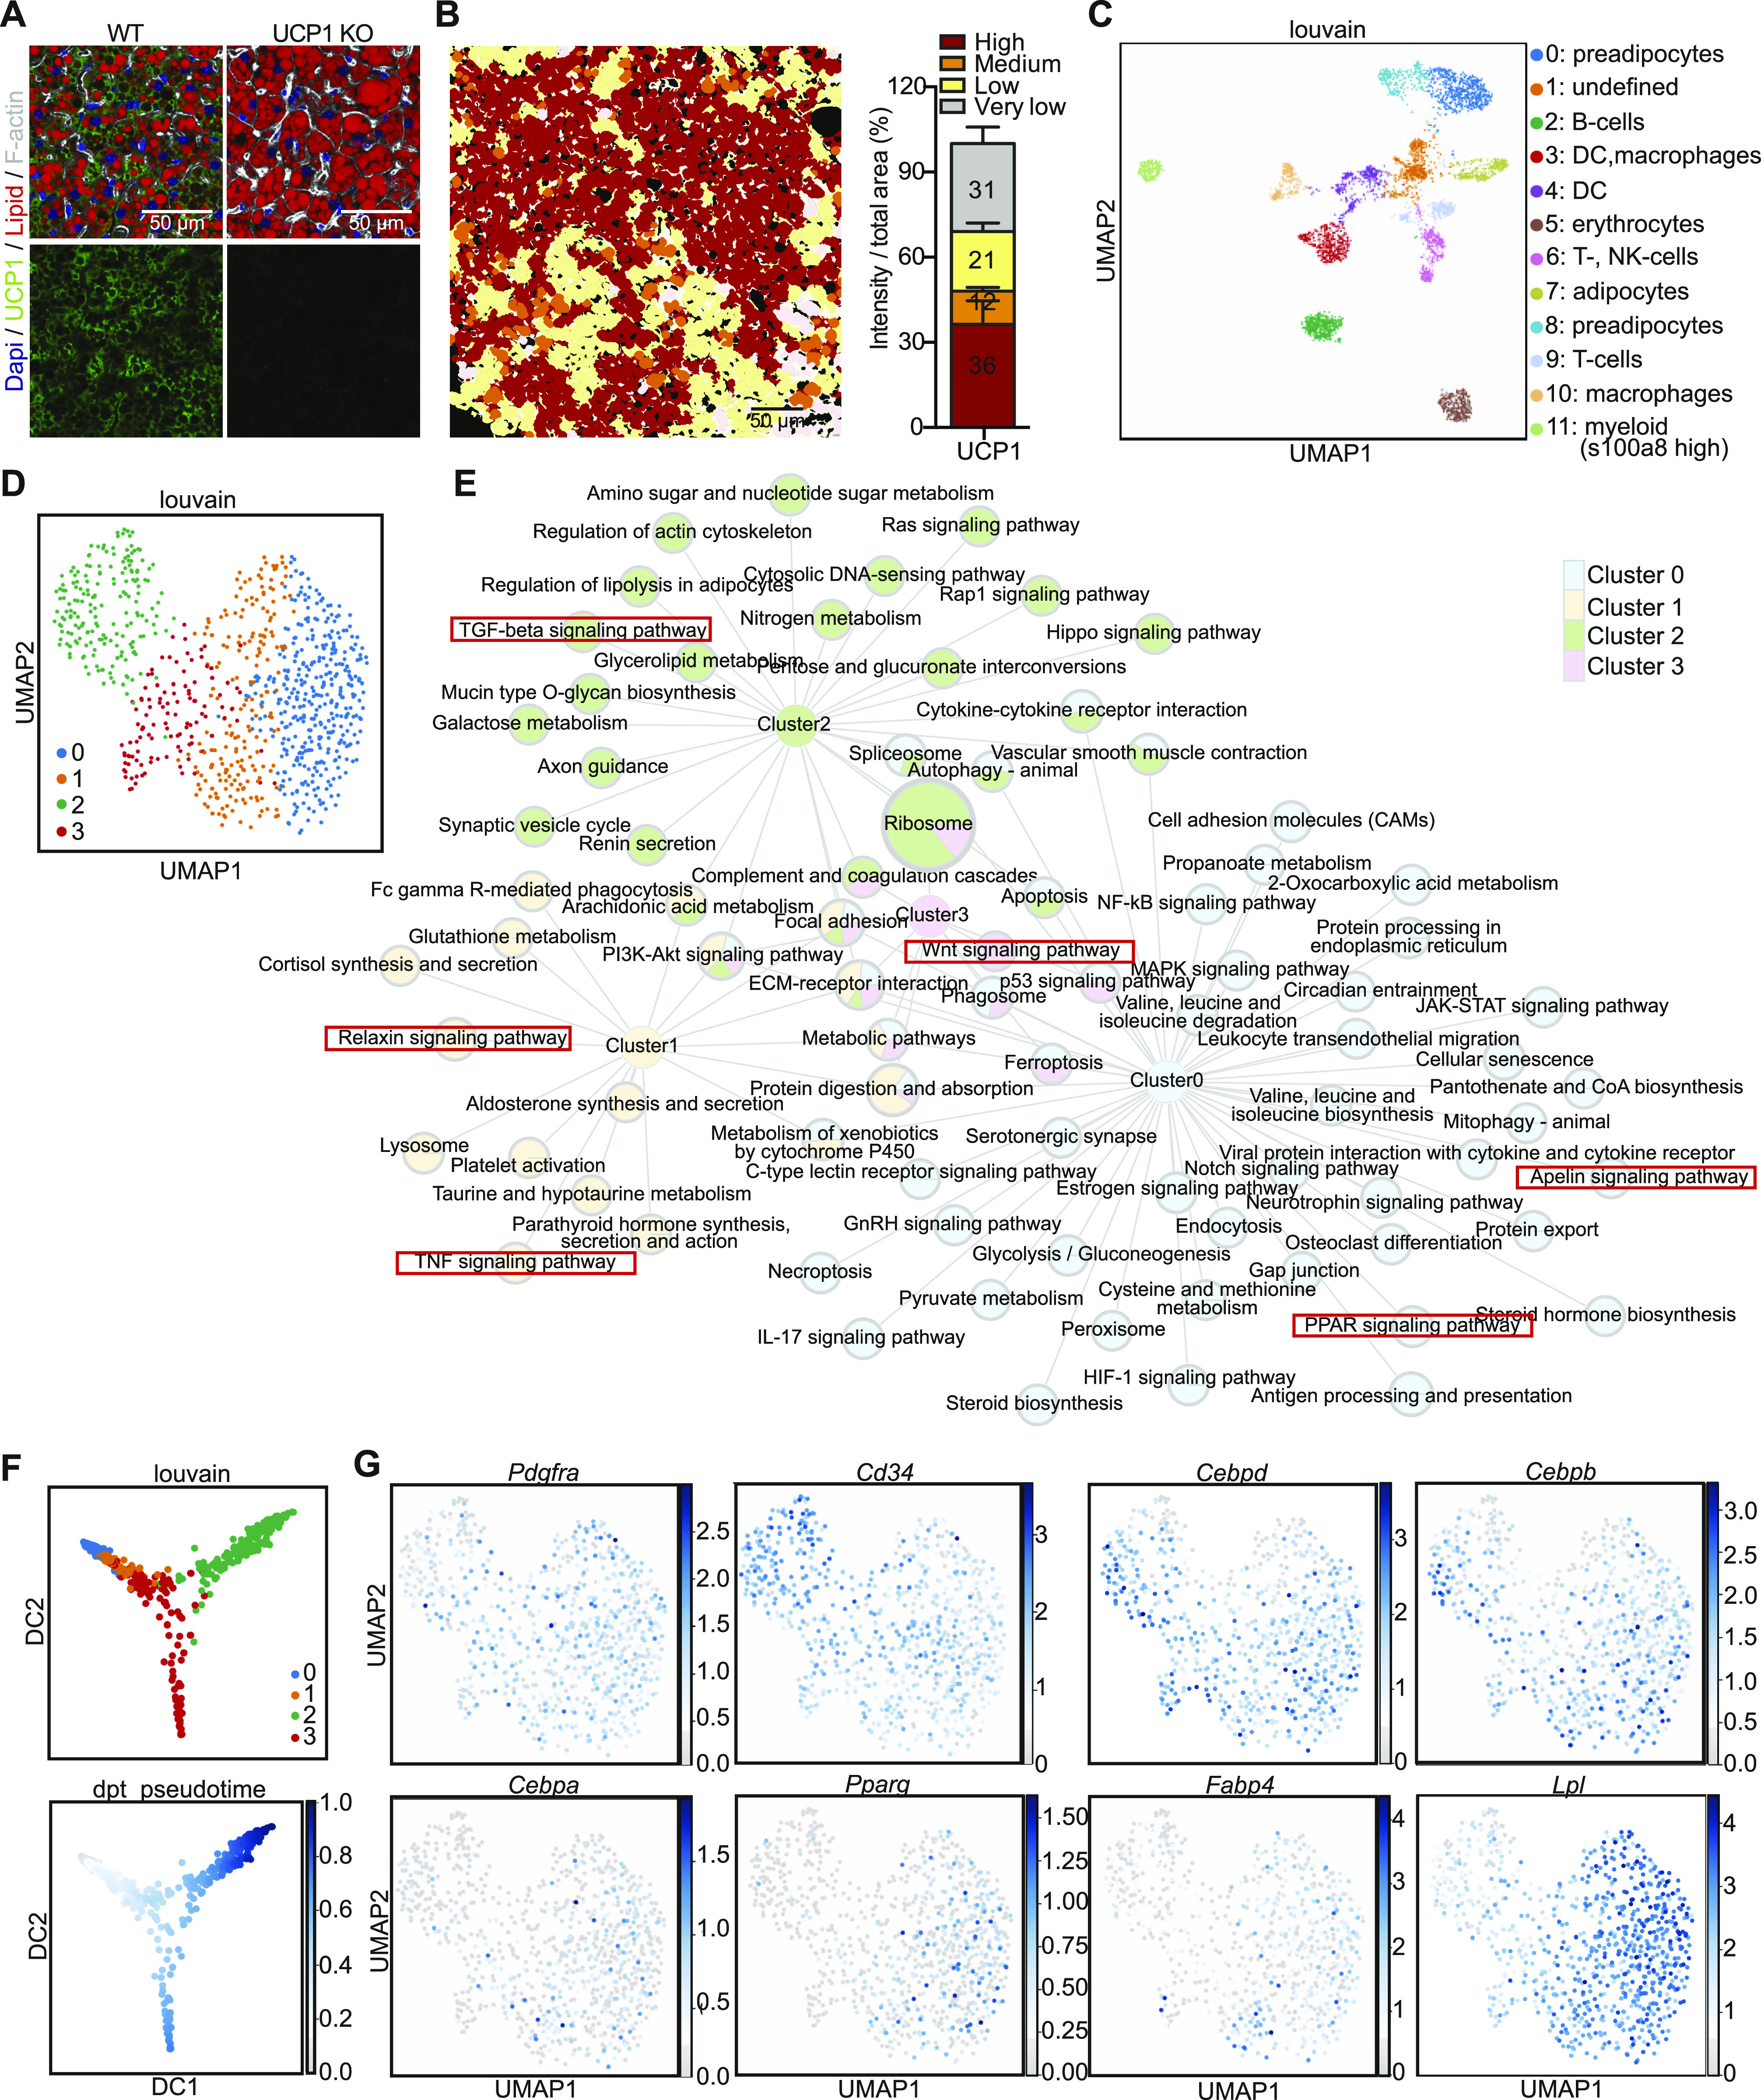
Figure 1. scRNAseq identifies distinct stages of brown adipocyte differentiation.
(A) Immunofluorescence staining of UCP1 (green), F-actin (white), lipid droplets (red), and DAPI (blue) from WT and UCP1 knockout mice. (B) Quantifications of UCP1 content in individual brown adipocytes in brown adipose tissue normalized to total area (right panel, n = 11). Lipid droplets are included into area measured, and F-actin was used to distinguish each cell. (C) UMAP computed on full processed single-cell RNA-seq data set with annotated louvain clusters superimposed. (D) UMAP computed on set of preadipocytes with louvain subclustering. (E) Network of KEGG-enriched pathways of preadipocyte clusters. Significantly enriched pathways are connected to the respective cluster nodes. Size of the pathway nodes and proportion of the node-pie-chart refer to −log10 of enrichment P-value. (D) Node colors refer to single-cell cluster identified in (D). (F) Diffusion map dimensionality reduction of preadipocytes colored by Louvain clusters (top panel) and pseudotime (lower panel). (D, G) Expression of Pdgfra, Cd34, Cebpd, Cebpb, Cebpa, Pparg, Fabp4, and Lpl in preadipocytes shown in (D). The expression values are size factor normalized and log-transformed.
Source data are available for this figure.

