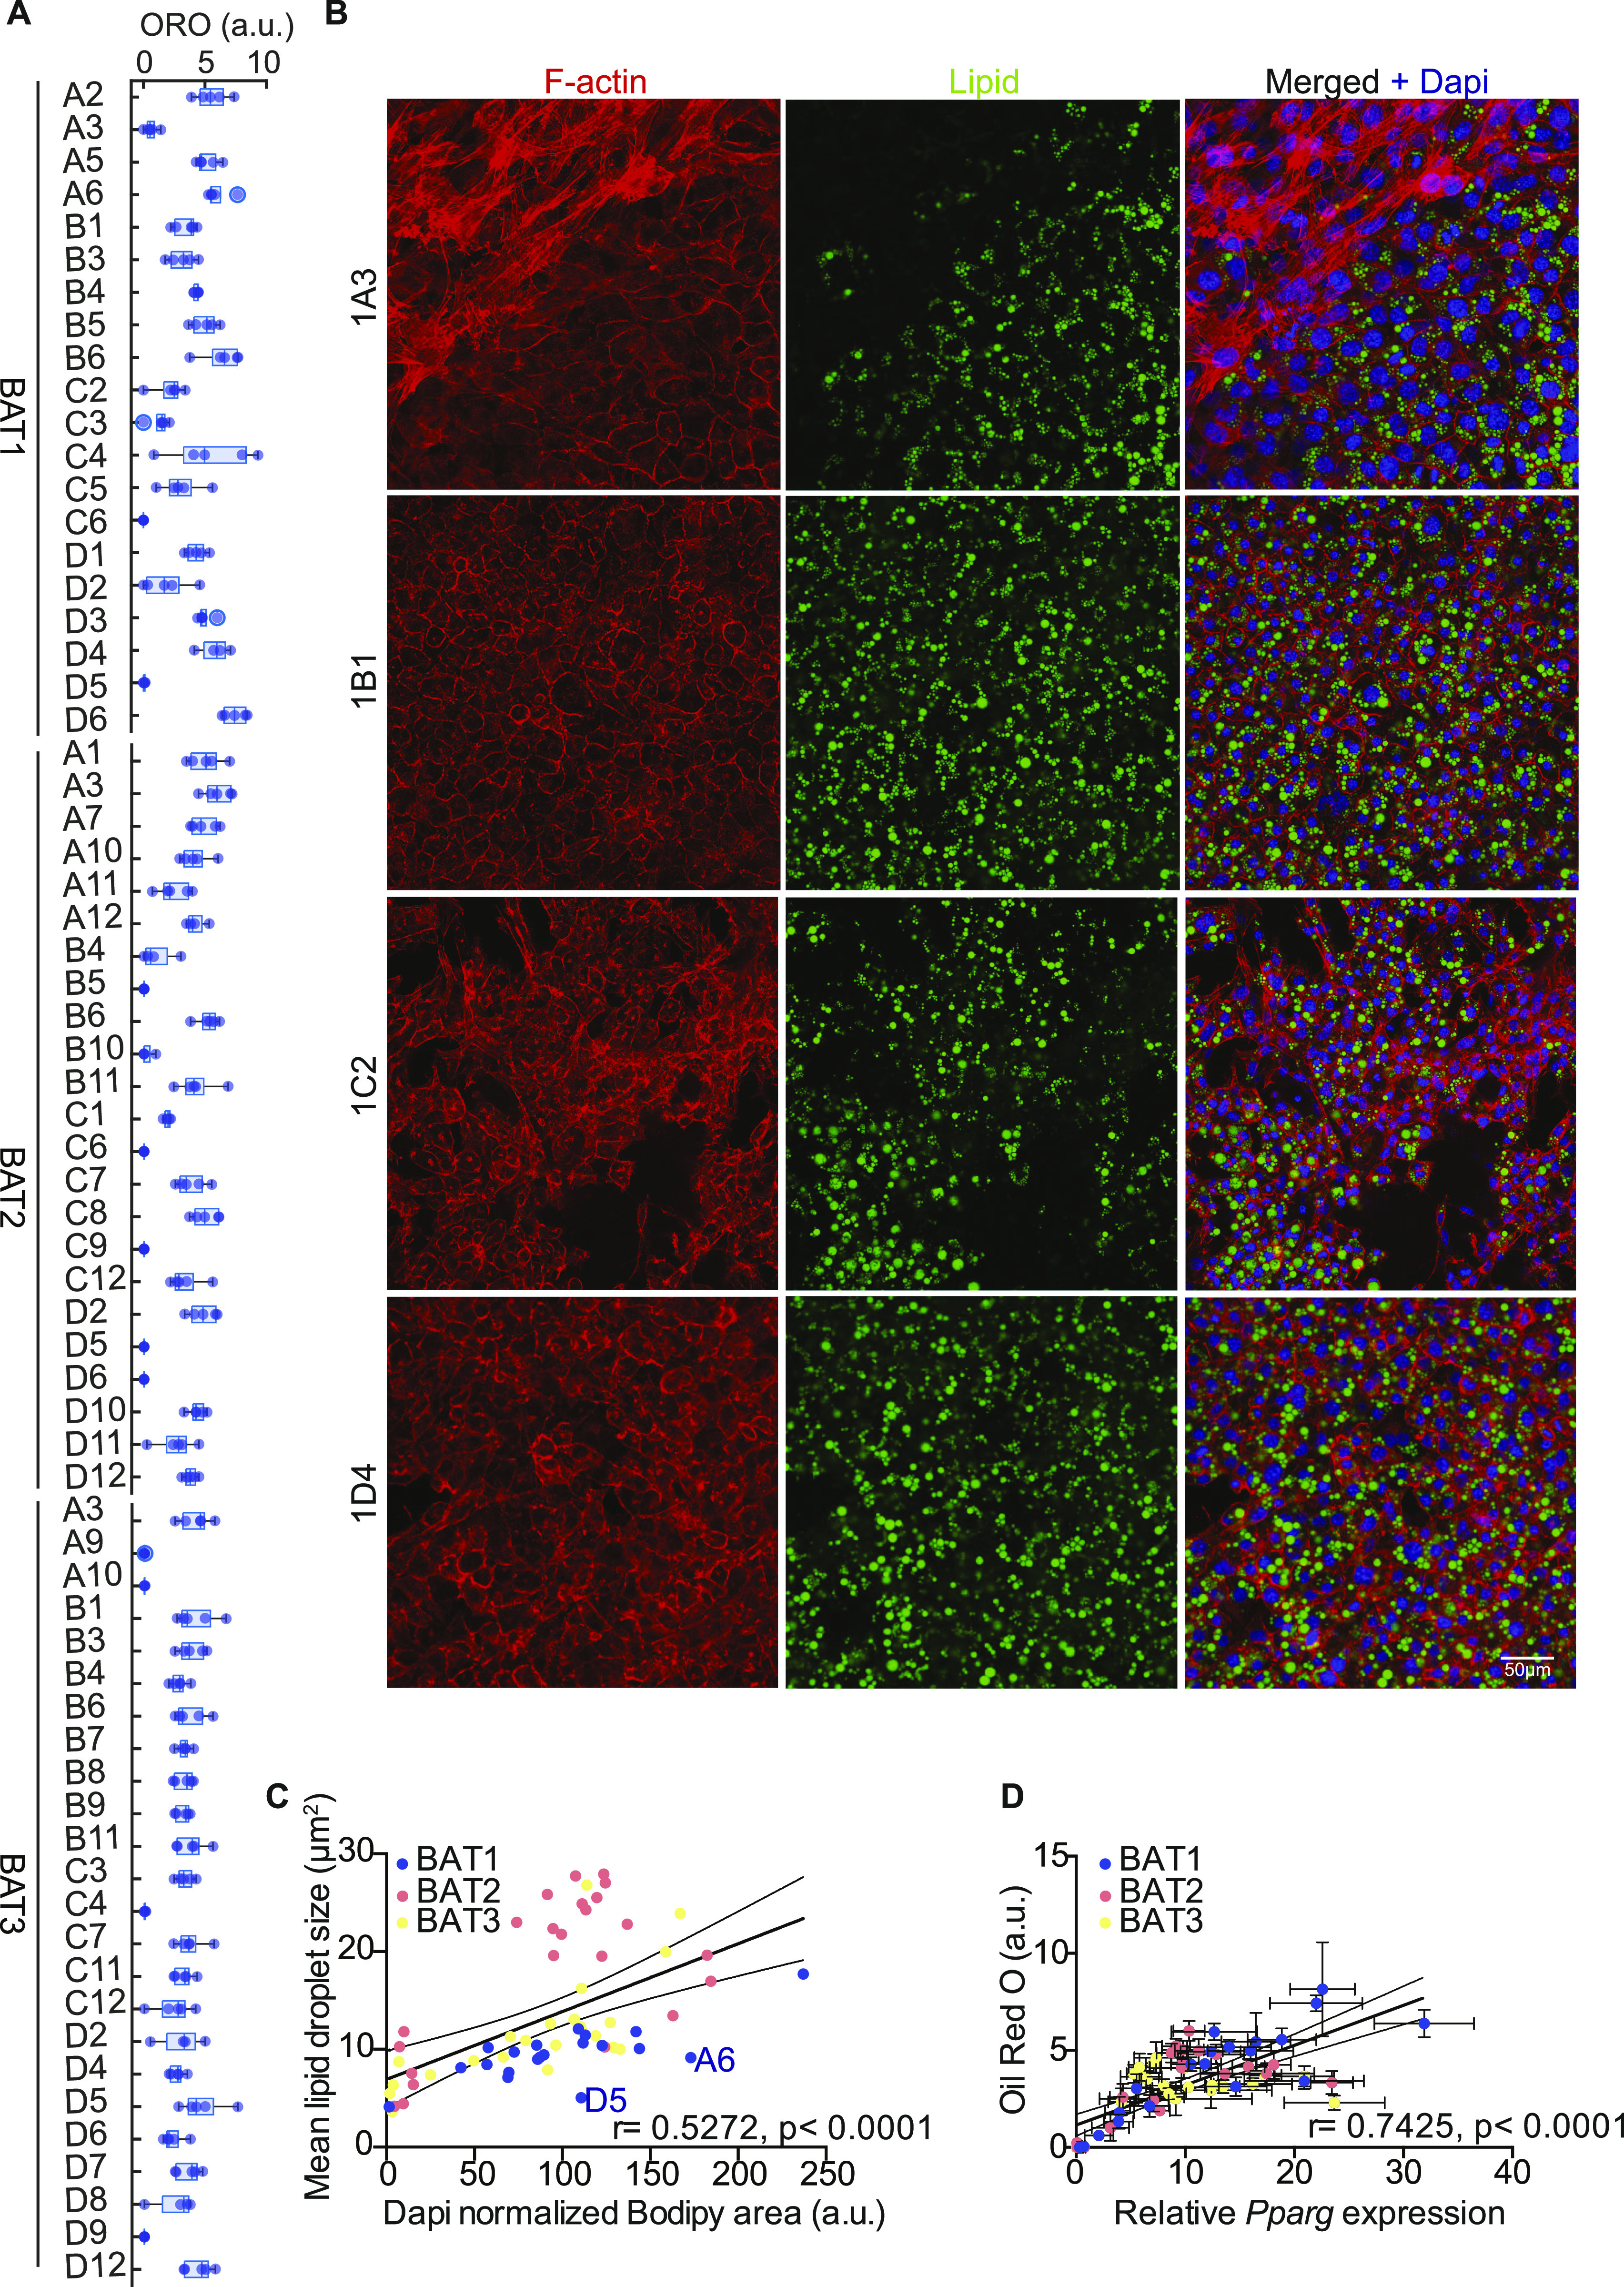
Figure 2. Heterogeneity in differentiation capacity and lipid accumulation of brown adipocyte clones.
(A) Quantification of relative lipid accumulation measured by Oil Red O staining at day 8 of differentiation from 67 immortalized brown preadipocyte clones (n = 4–6; mean OD normalized to DAPI ± SEM). (B) Representative images of differentiated cell lines, stained with F-actin (red), lipid droplets (green), and DAPI (blue). (C) Correlation between mean lipid droplet size and lipid area normalized by the number of nuclei per clone (n > 200), calculated from pictures shown in Supplemental Data 2 (1.1MB, pdf) . Values are mean of different area scanned per clones (n = 9). (D) Correlation analysis of Pparg expression and lipid accumulation. The values were mean ± SEM (n = 5).
Source data are available for this figure.

