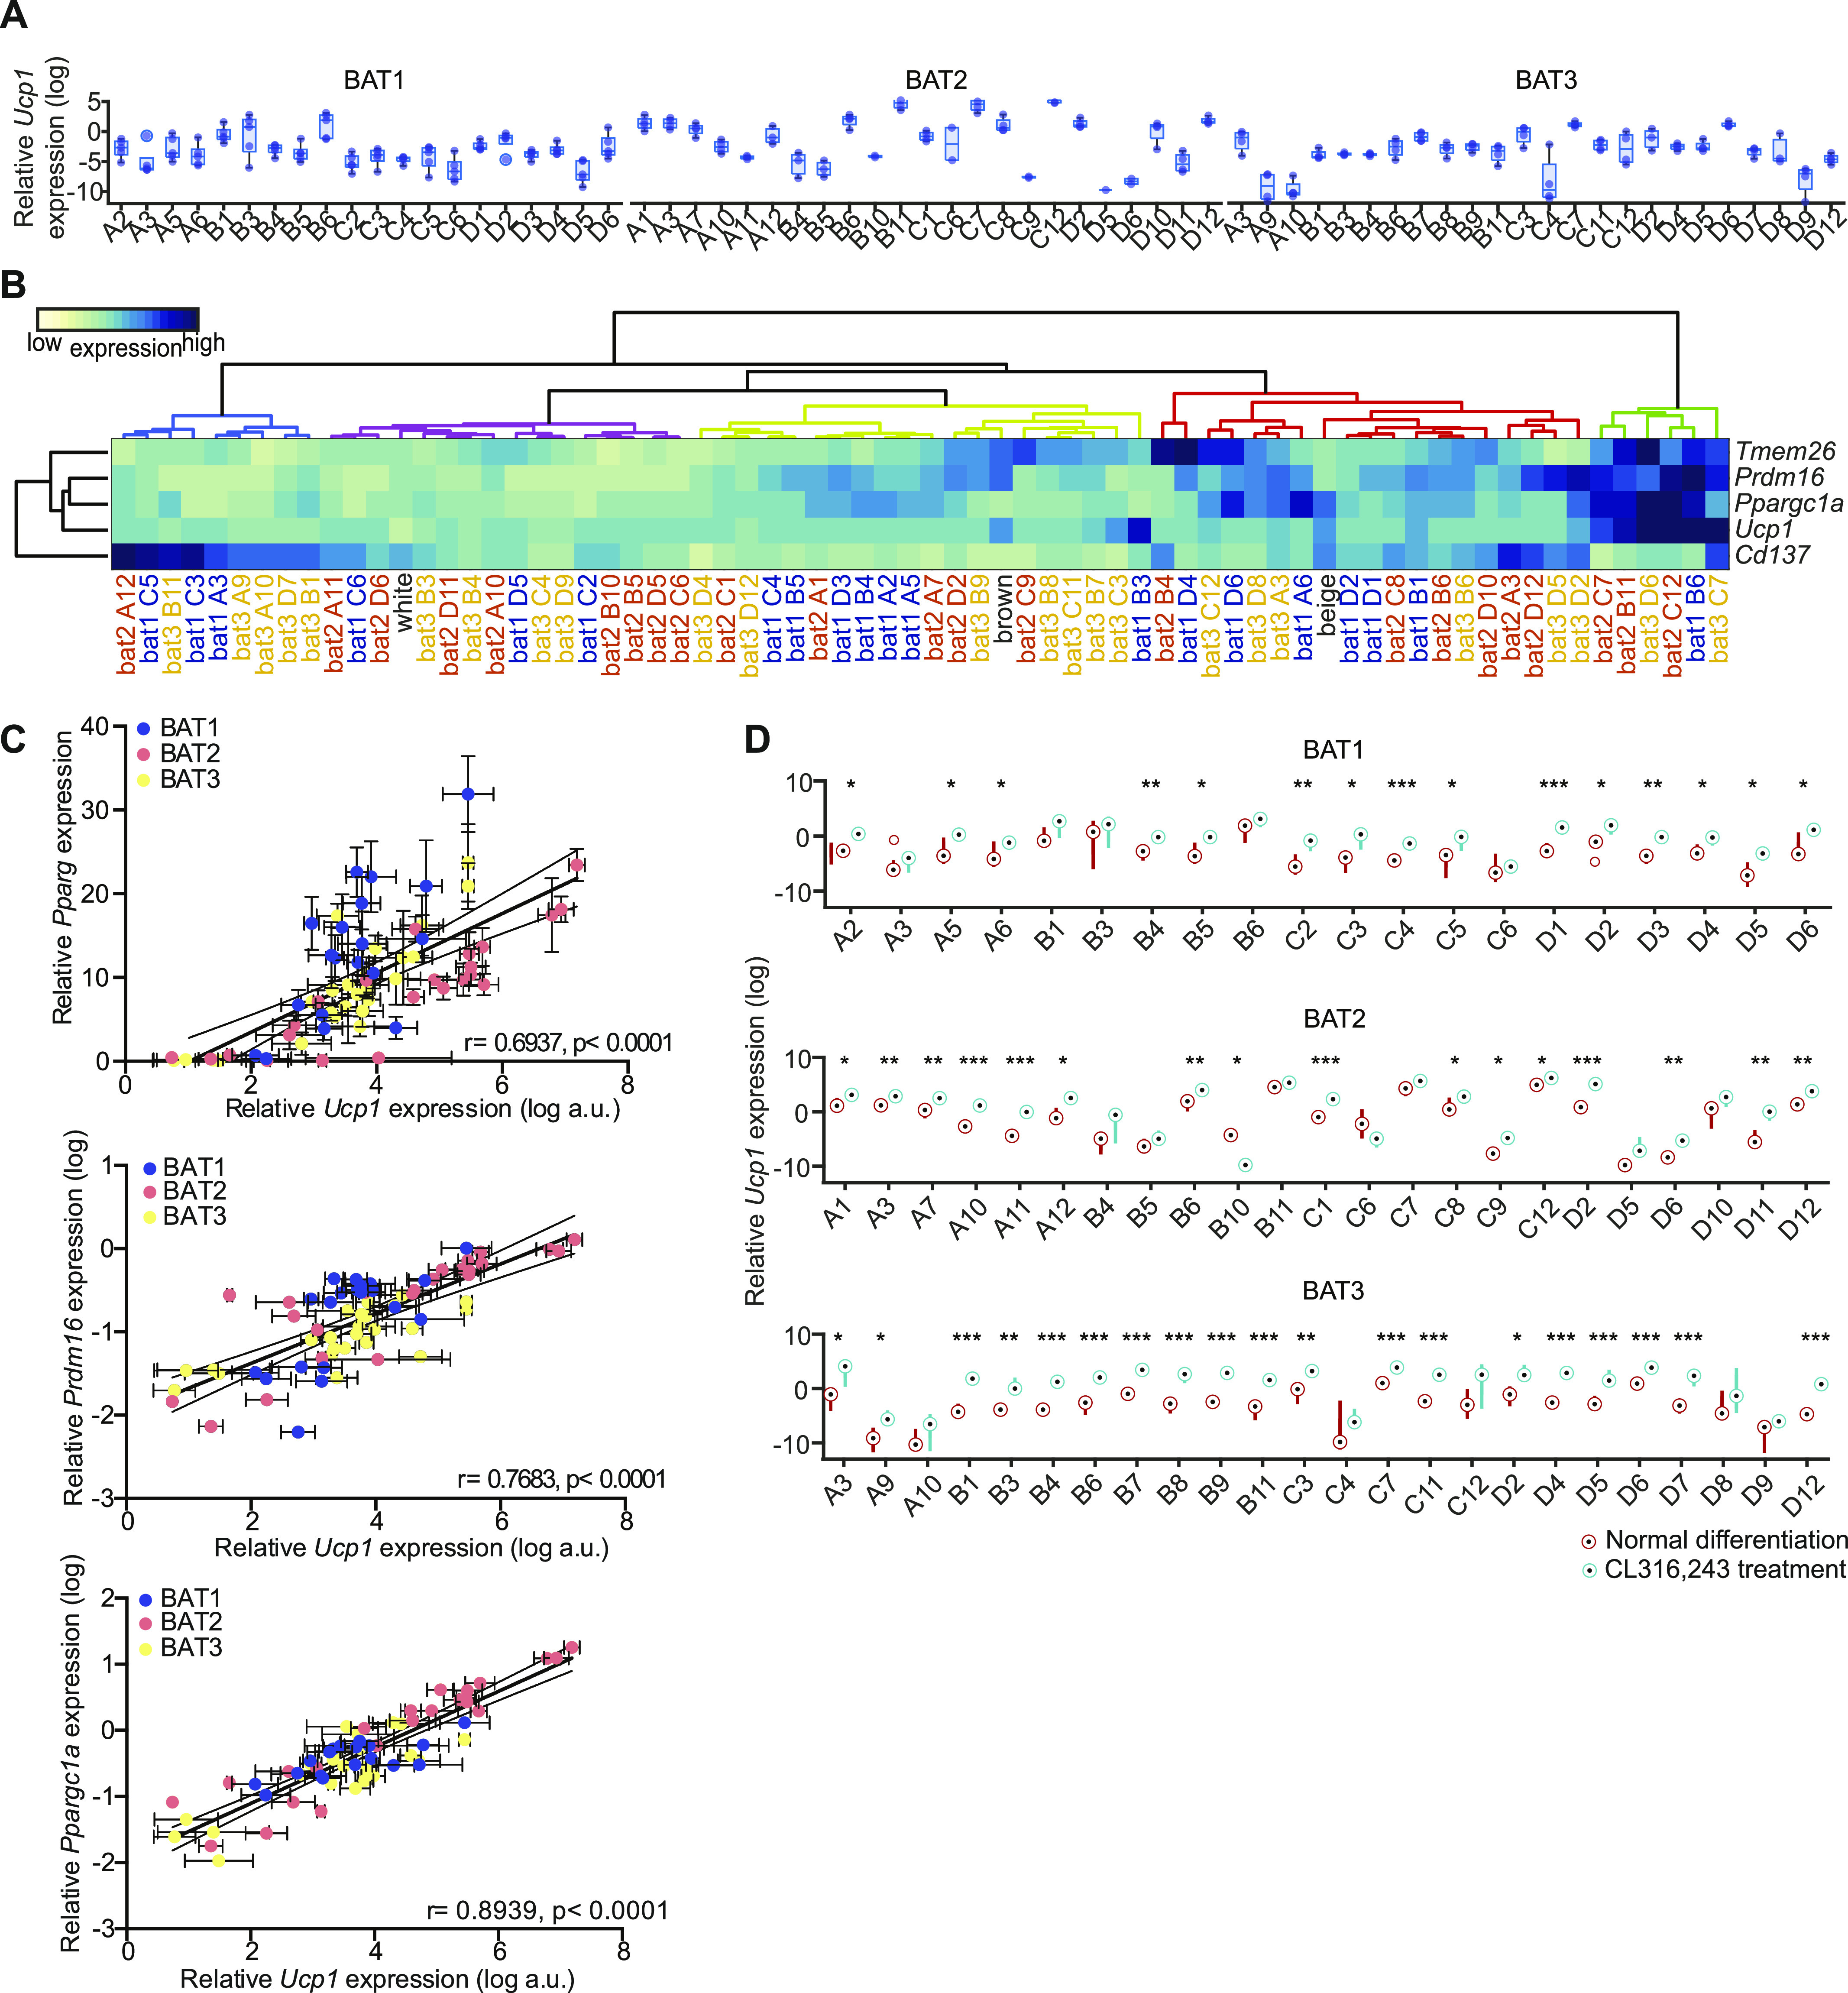
Figure 3. Brown adipocyte clones heterogeneously express brown, beige, and white fat markers.
(A) mRNA expressions of Ucp1 at day 8 of differentiation (n = 2–5). (B) Heat map of mRNA expression for different adipocyte markers in all 67 clones, and in vitro differentiated white, beige and brown adipocytes at day 8 of differentiation (n = 3–8). Median expression for each cell line was transformed to log scale and gene wise z-scores were computed independently for each cell line. Dendrogram colors denote identified adipocyte clone cluster. (C) Correlation of Ucp1 with Pparg (left panel), Prdm16 (middle panel), and Ppargc1a (right panel). The values were mean ± SEM, and log transformed for Ucp1, Prdm16, and Ppargc1a (n = 4–5). Gene expression was normalized to Tbp. (D) Ucp1 expression of controls and cells treated for 3 h with 0.5 μM CL-316,243 (n = 2–5).
Source data are available for this figure.

