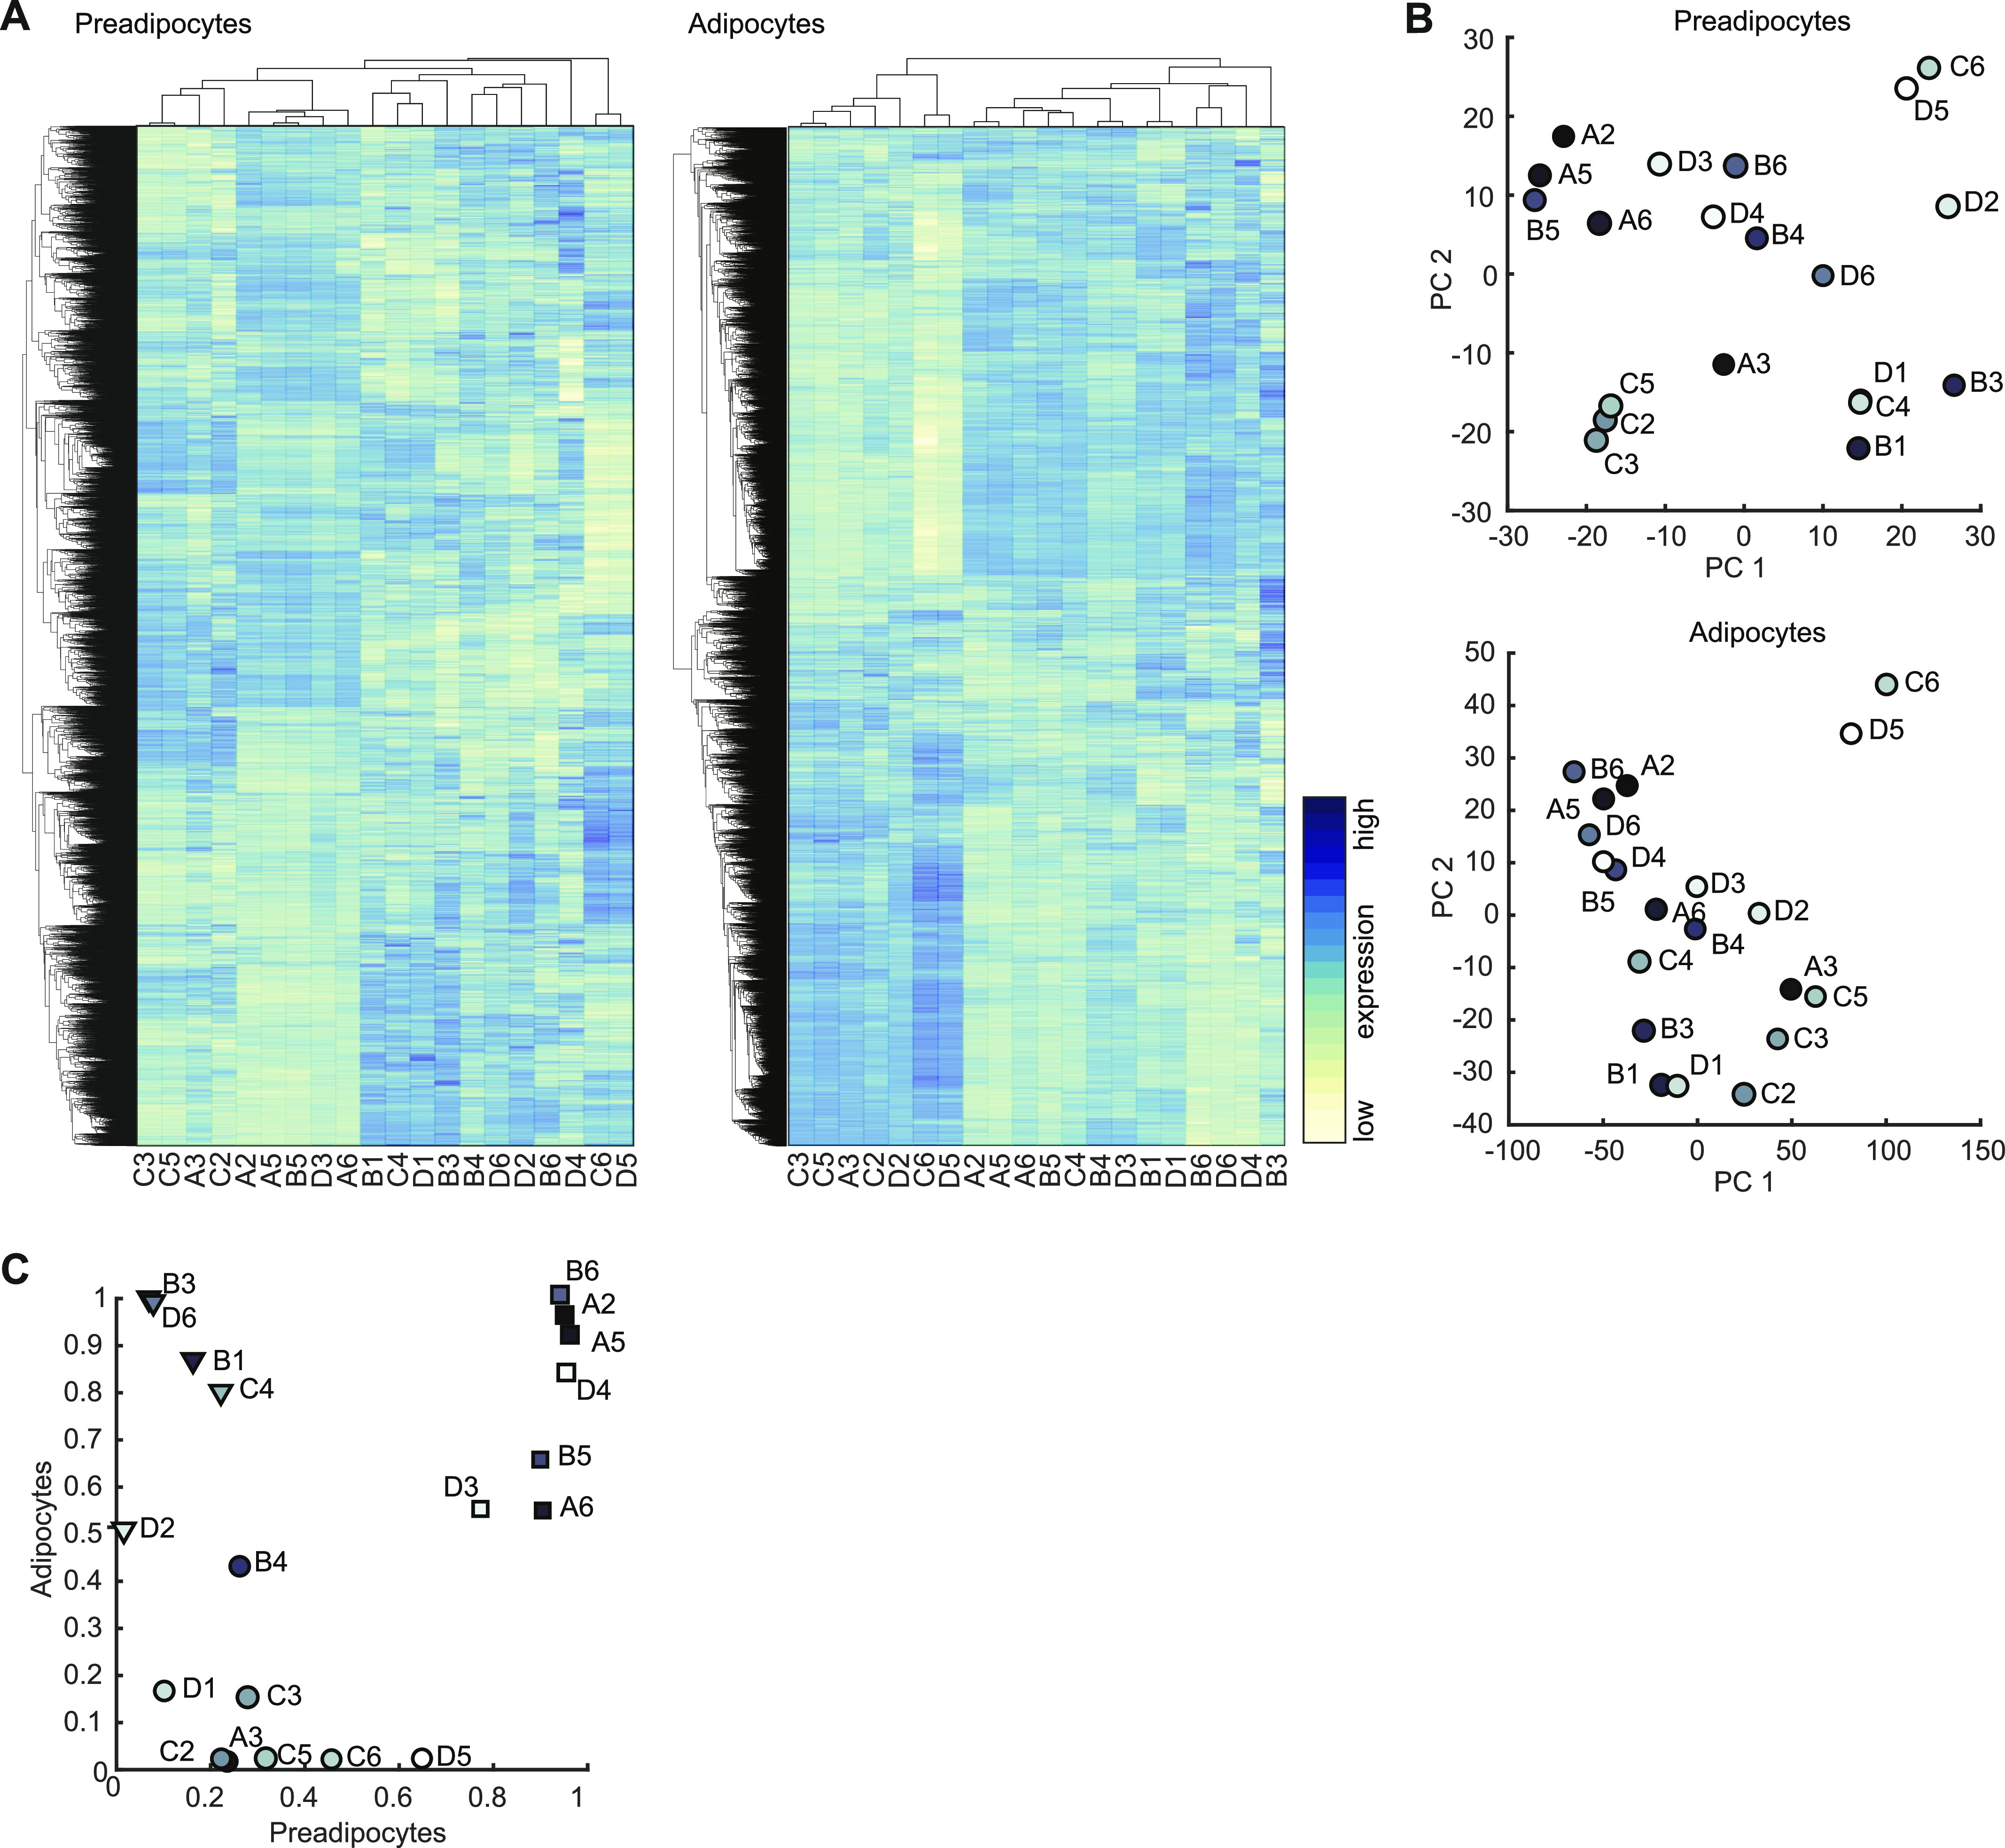
Figure 4.

Transcriptional profiling of selected BAT clones. (A) Heat map of all 9,483 expressed genes in preadipocyte. Gene expression in rows was z-score normalized, columns refer to cell lines (left panel). Hierarchical clustering heat map of all 10,363 expressed genes in differentiated adipocytes (right panel). (B) PCA plot of the first two PC of preadipocytes expression data (upper panel) and differentiated adipocytes (lower panel). (C) Scatterplot comparison of the estimated brown adipose tissueness from pre- and differentiated adipocyte cell lines. Dots, triangles, and square indicate the three clusters identified by k-means clustering.
