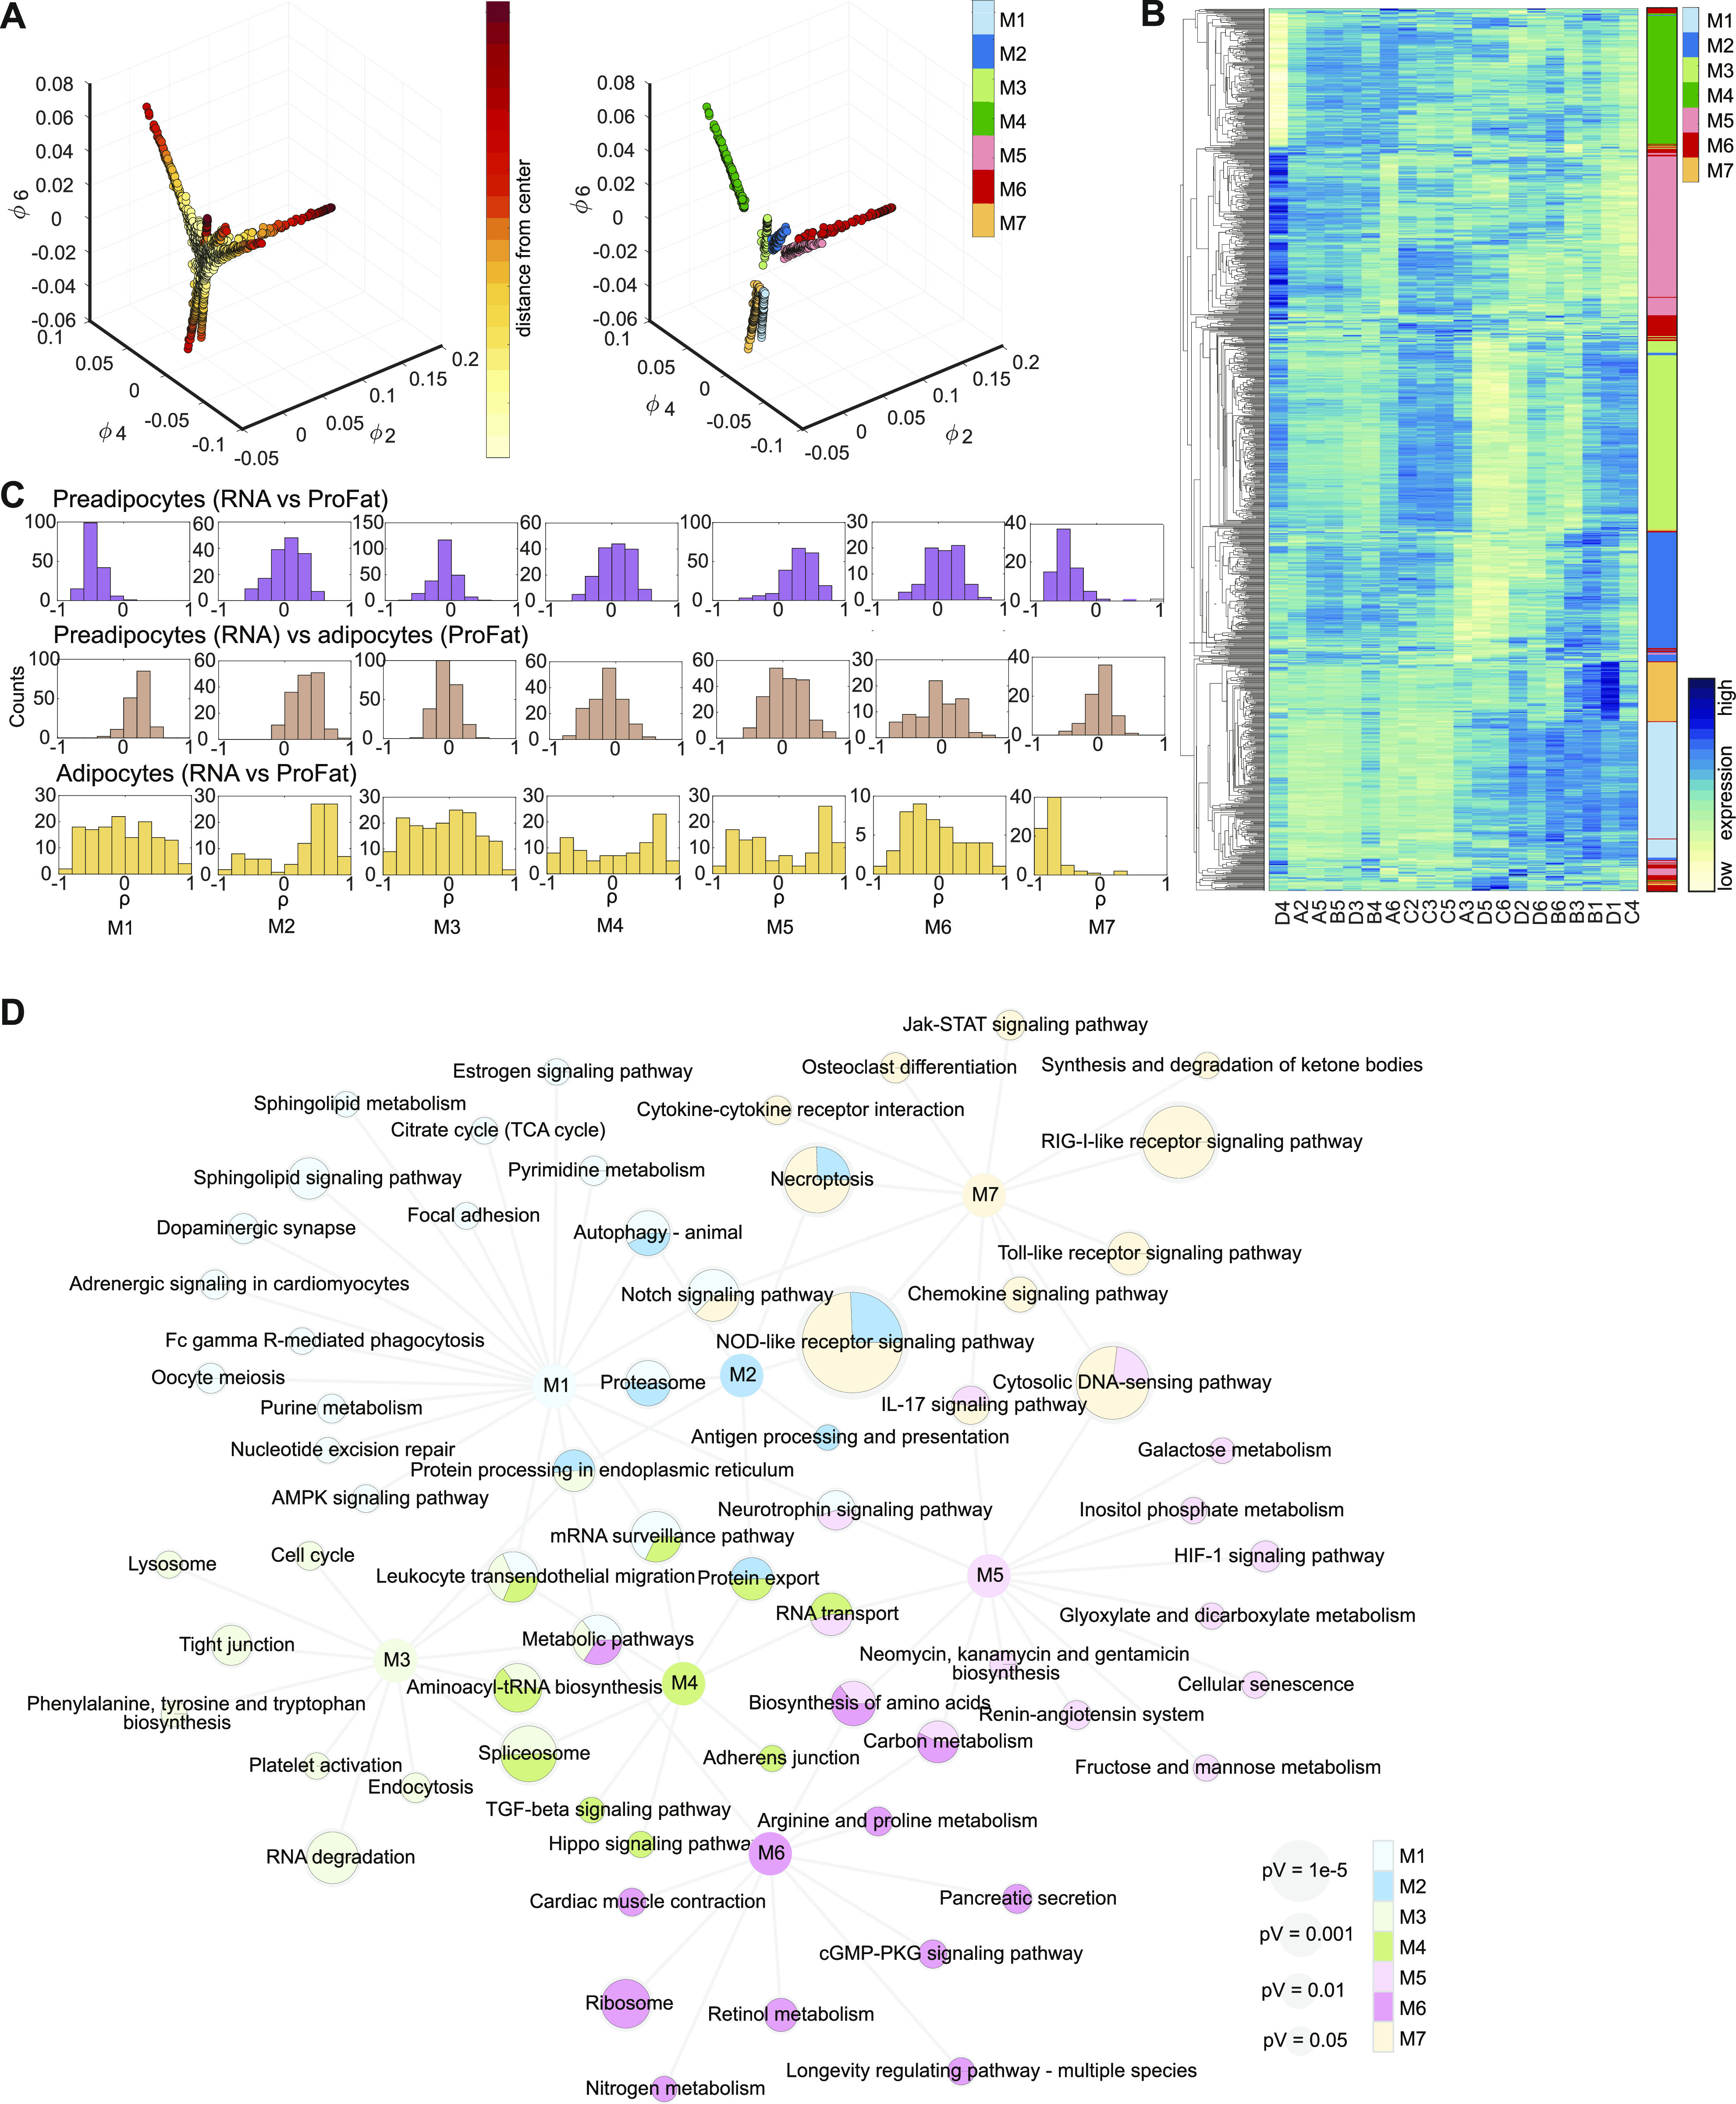
Figure 5. Laplacian eigenmap–based extraction of expression modules.
(A) Brown preadipocyte gene expression in Laplacian eigenmap–derived low dimensional space. Expression of the three eigenvectors ϕ2, ϕ4, and ϕ6. Distance from estimated center is color-coded (left panel). After removal of genes with low variance module membership is coded in colors (right panel). (B) Heat map of hierarchical clustered module genes in rows. Gene expression was z-score normalized. Module membership is indicated by the right color bar. (C) Distribution of correlation coefficients of the gene-wise comparison of expression to estimated brown adipose tissue (BAT)ness for each module. Upper line: preadipocyte gene expressions versus estimated BATness of preadipocytes from ProFat database. Middle line: preadipocyte expressions versus differentiated BATness from ProFat database. Lower line: differentiated adipocyte expressions versus differentiated BATness from ProFat database. (D) Network of KEGG-enriched pathways. Significantly enriched pathways are connected to the respective module nodes. Size of the pathway nodes and proportion of the node-pie-chart refer to −log10 of enrichment P-value. Color of the nodes refers to module membership.
Source data are available for this figure.

