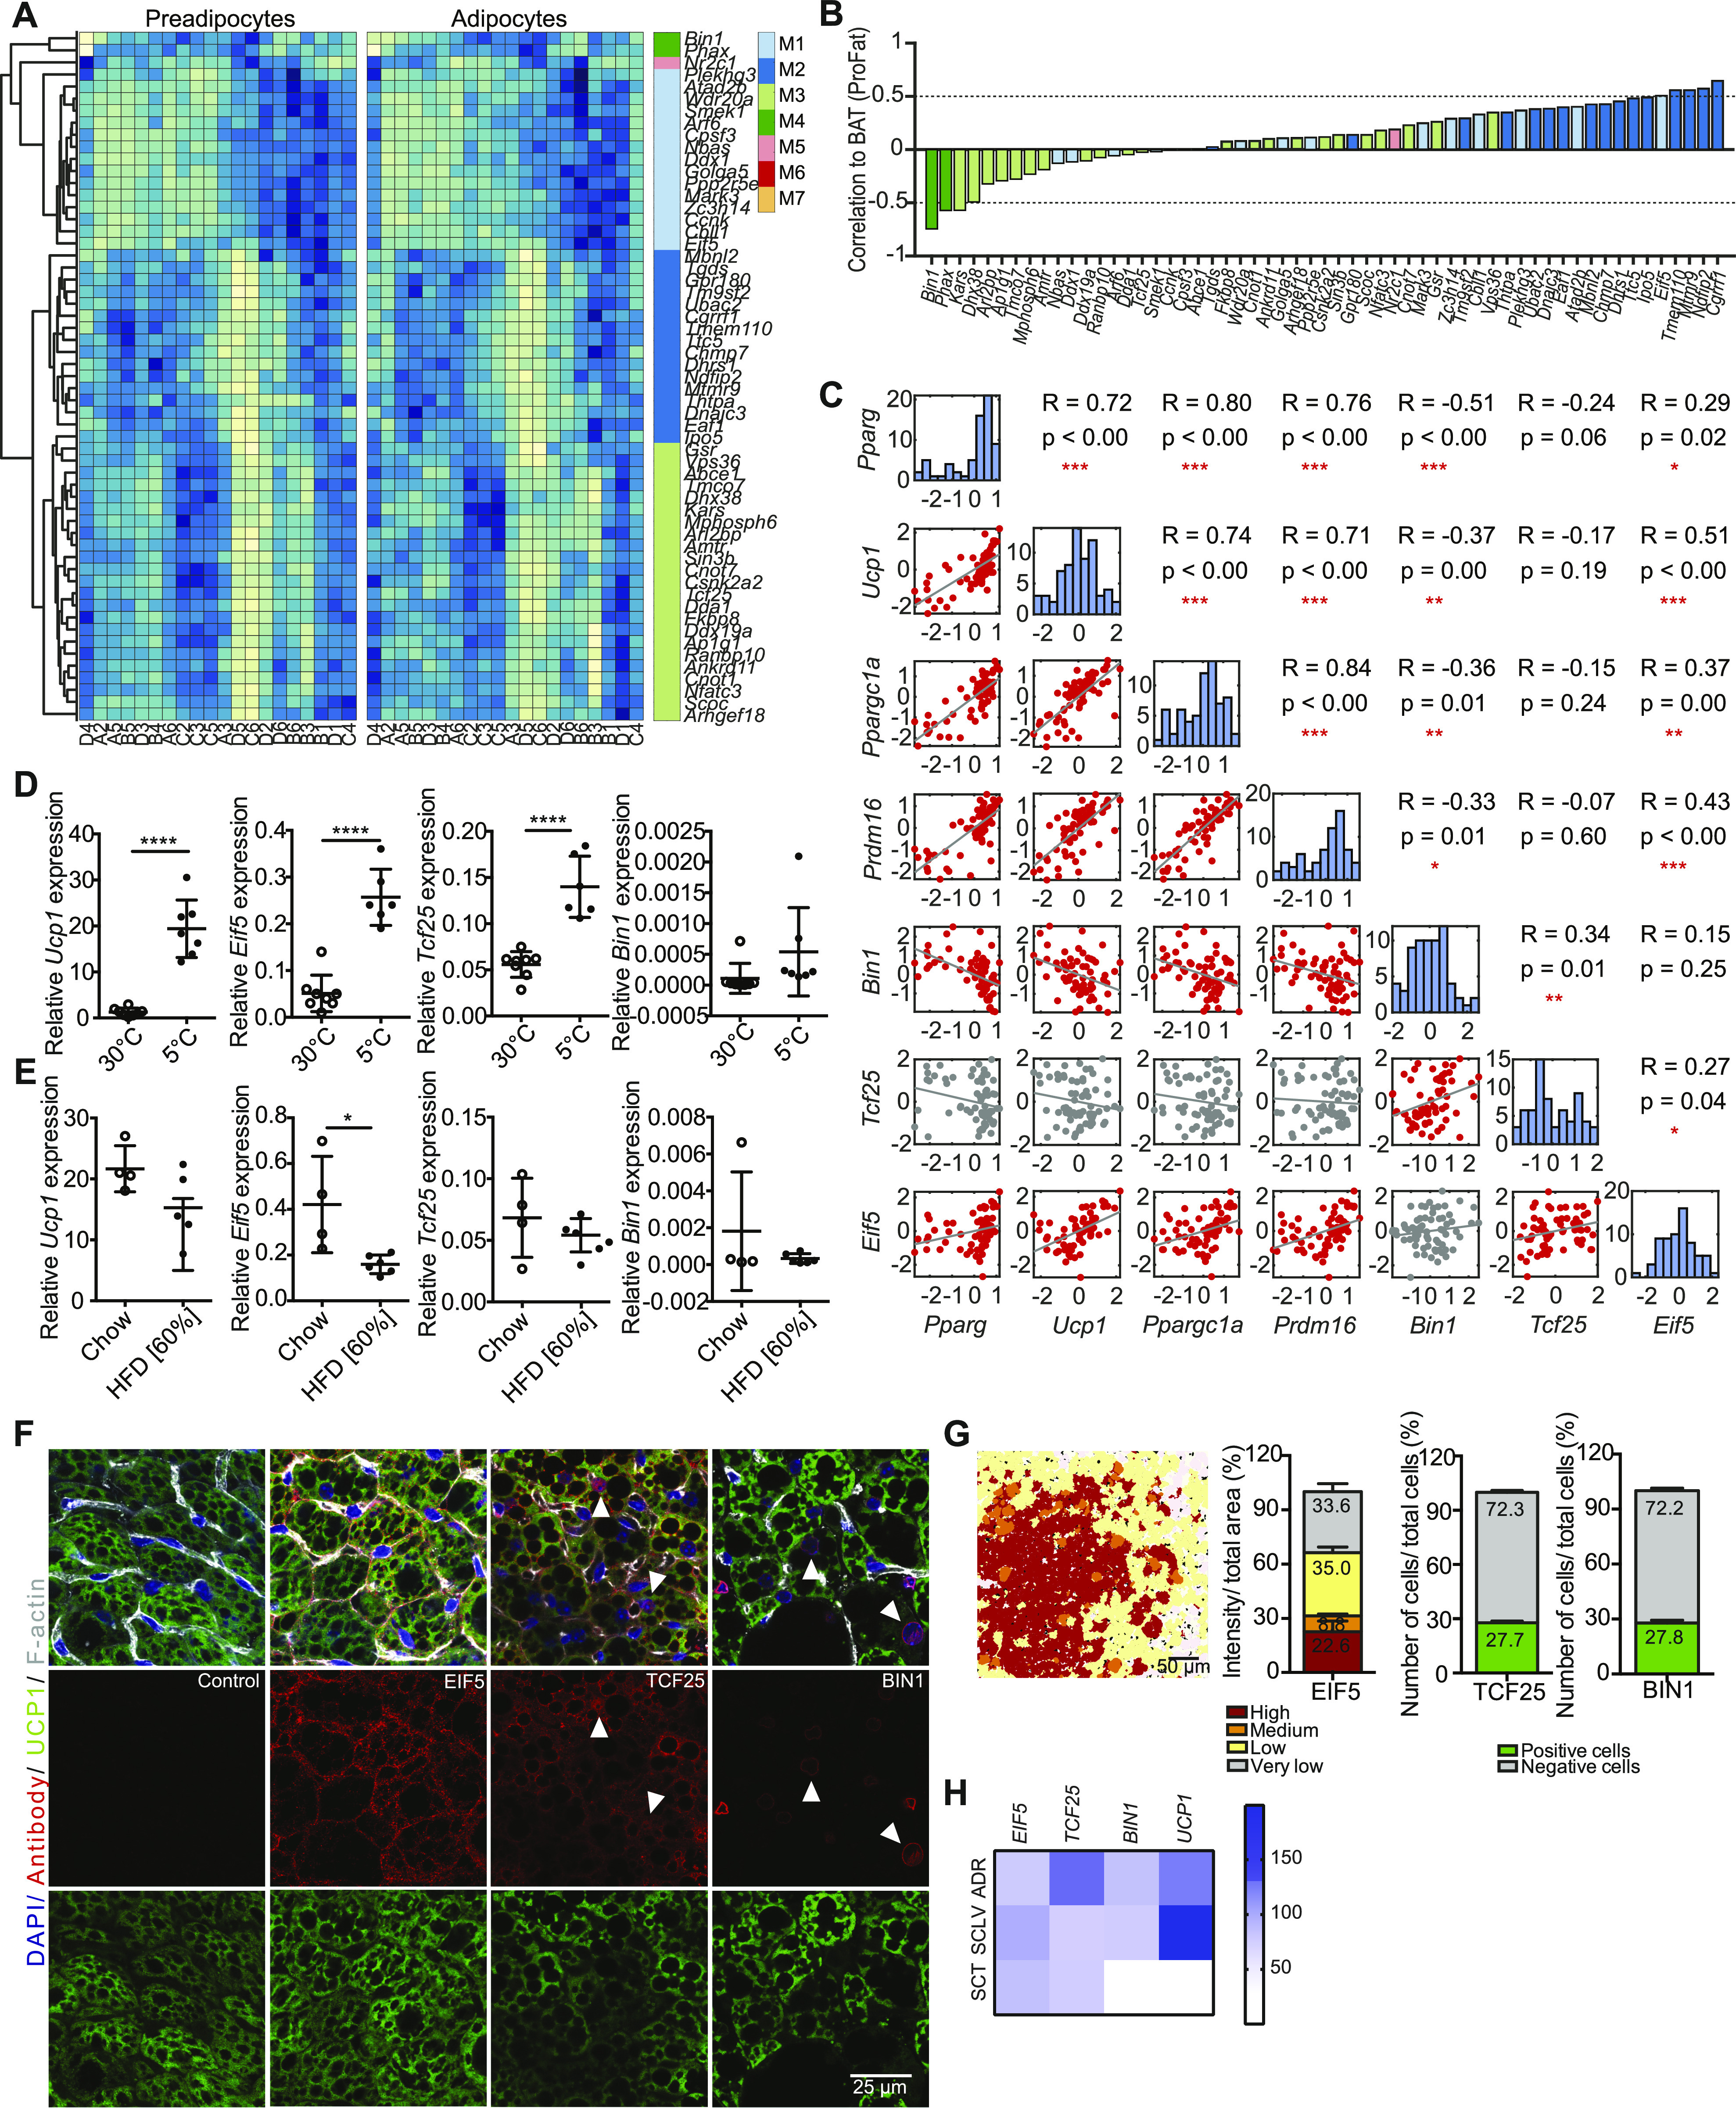
Figure 6. EIF5, TCF25, and BIN1 mark subsets of brown adipocytes.
(A) Heat maps of stably expressed genes of preadipocytes (left panel) and differentiated brown adipocytes (right panel). Module membership is indicated by the right color bar. (B) Correlation coefficients for stable expressed genes compared with estimated brown adipose tissue (BAT)ness. Color of bars indicates module membership. (C) Correlation plot for pairwise comparison of selected markers to selected stably expressed genes. Red plots denote a significant correlation. (D) Expression of Ucp1, Eif5, Tcf25, and Bin1 in mice kept in cold or thermoneutrality (n = 6–8, data are mean expressions normalized to B2m ± SEM). (E) Expression analysis of Ucp1, Eif5, Tcf25, and Bin1 in chow- and high-fat diet-fed mice (n = 4–6, data were mean expressions normalized to B2m ± SEM). (F) BAT co-staining for EIF5, TCF25 or BIN1 (red) and UCP1 (green), with F-actin (gray) and Dapi (blue) from wild-type C57BL/6J mice. Arrows indicate nuclear staining. (G) Representative color gradient picture of EIF5 staining on BAT (left panel), and percentage area of different EIF5 intensity (high, medium, low, and very low) normalized to total area (second panel, n = 8 sections). Quantification of TCF25- and BIN1-positive and negative cells in percentage of total cells (n = 9–18 sections). (H) Heat map of mRNA expression in human periadrenal (ADR), supraclavicular (SCLV), and subcutaneous (SCT) adipose tissue from six different donors for ADR and SCLV, and five donors for SCT. (A, B) Based on RNAseq data and remaining analysis based on RT-qPCR data. *P < 0.05, **P < 0.01, ***P < 0.001, ****P < 0.0001.
Source data are available for this figure.

