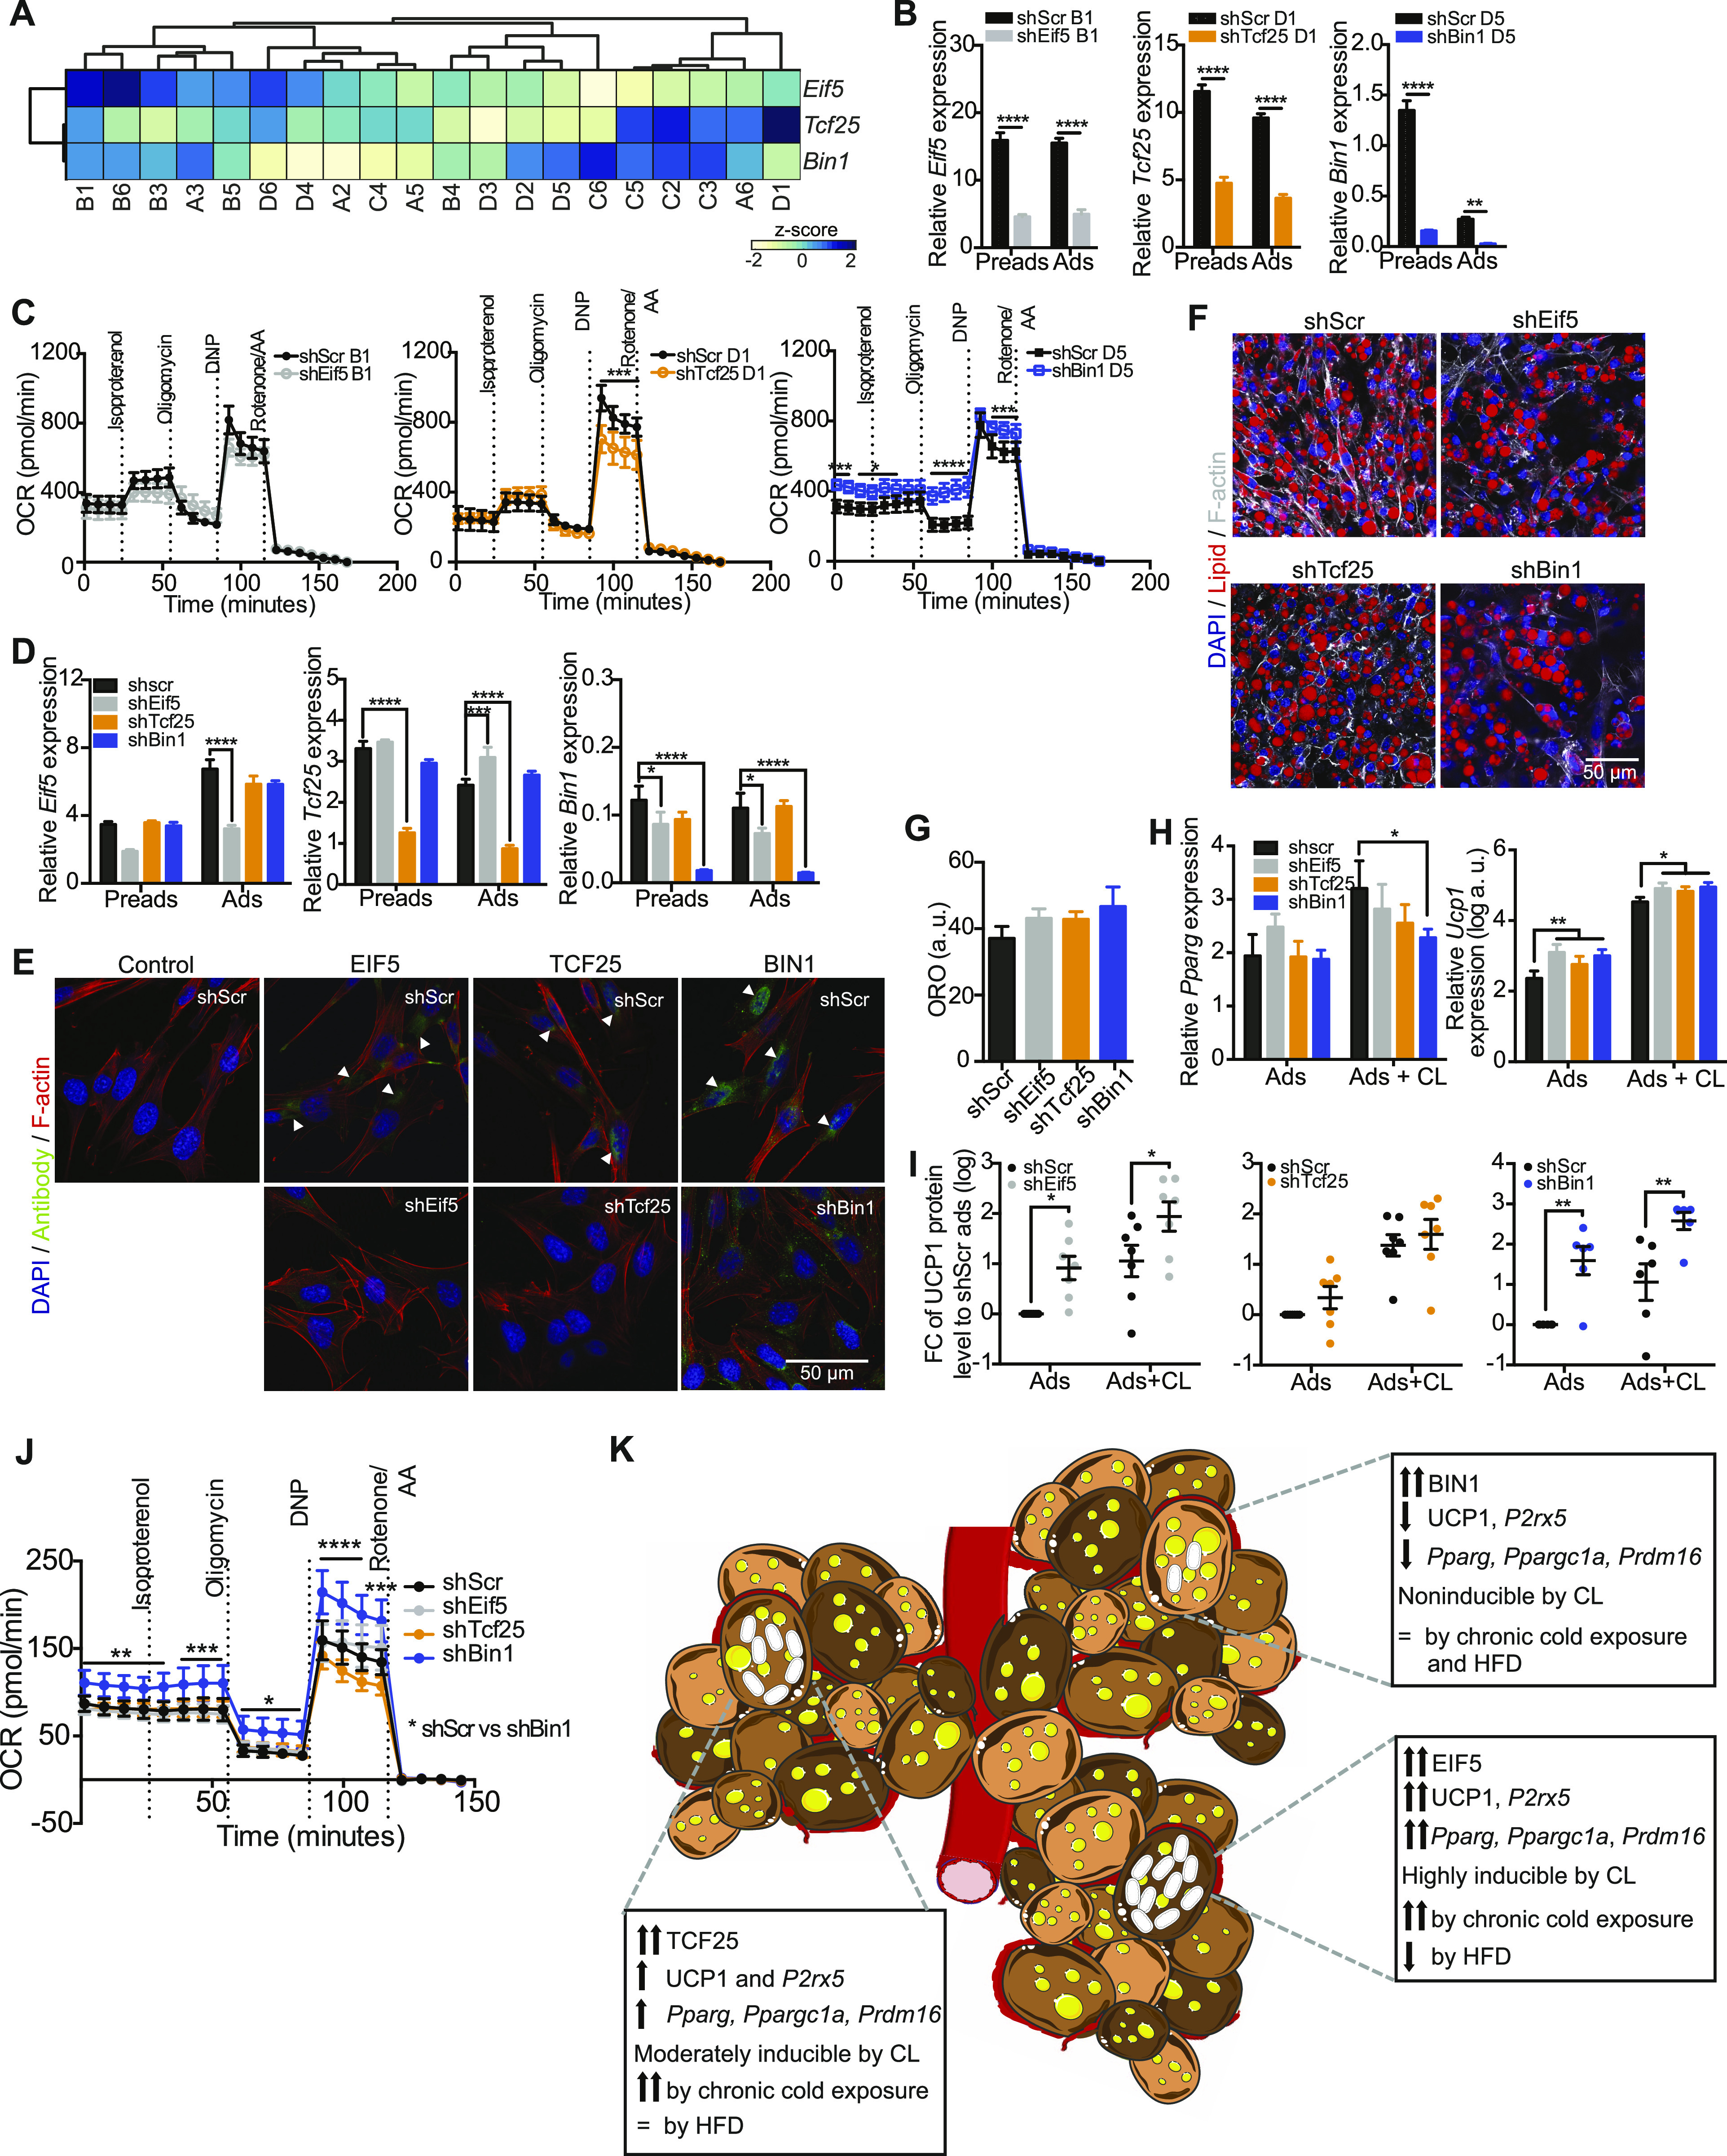
Figure 7. Loss of Bin1 increases basal respiration and UCP1 protein content.
(A) Heat map and hierarchical clustering of cell lines with regard to the mRNA expressions of Eif5, Tcf25 and Bin1. (B) Expression of Eif5, Tcf25, and Bin1 in control cells (shScr) of different clones (B1, D1, and D5) and the respective knockdown (shEif5 B1, shTcf25 D1, and shBin1 D5); Preads (d0 of differentiation) and Ads (d8 of differentiation) (n = 5). (C) Oxygen consumption rate of shScr B1 and shEif5 B1 (left panel), shScr D1, and shTcf25 D1 (middle panel) and shScr D5 and shBin1 D5 (right panel) at day 8 of differentiation measured by Seahorse (n = 4–5). (D) Expression of Eif5, Tcf25, and Bin1 in control cells (shScr) and respective knock-down (shEif5, shTcf25, and shBin1); Preads (d0 of differentiation) and Ads (d8 of differentiation) (n = 5). (E) Immunofluorescence staining of EIF5/TCF25/BIN1 (green), F-actin (red), and DAPI (blue) on shScr/shEif5/shTcf25/shBin1 preadipocytes. (F) Representative images of differentiated cell lines (shScr, shEif5, shTcf25, and shBin1) stained with F-actin (white), lipid droplets (red), and DAPI (blue). (G) Quantification of relative lipid accumulation measured by Oil Red O staining at day 8 of differentiation from knockdown cell lines (n = 4, mean OD normalized to DAPI ± SEM). (H) mRNA expressions of Pparg (left panel) and Ucp1 (right panel) on shScr, shEif5, shTcf25, and shBin1 adipocytes and CL-316,243-treated adipocytes (0.5 μM CL-316,243 for 3 h; n = 6). (I) Quantification of Western blots for UCP1 (Cat. no. 10983; Abcam) in shScr, shEif5, shTcf25, and shBin1 adipocytes and adipocytes treated with 0.5 μM CL-316,243 for 6 h (n = 6–7) normalized to β-actin. Values are fold changes to the respective shScr adipocytes (ads). (J) Oxygen consumption rate of control and knockdown cell lines at day 8 of differentiation measured by Seahorse (n = 3); data were normalized by non-mitochondrial respiration. (K) Schematic illustration of brown adipose tissue heterogeneity: Murine brown adipose tissue is composed of functionally distinct brown adipocytes. We identify EIF5 expressing brown adipocytes as “classical” brown adipocytes, with high UCP1 content and mitochondrial uncoupling. TCF25 expressing brown adipocytes are similar, albeit with lower UCP1 expression. In contrast, BIN1-expressing brown adipocytes appear in a dormant state, expressing low UCP1 levels with little response to beta adrenergic stimulation. However, loss of BIN1 or chemical mitochondrial uncoupling reveals high thermogenic capacity of these cells. Subpopulations of brown adipocytes are color coded regarding to their thermogenic capacity, with the highest shown in dark brown (Eif5high), followed by brown (Tcf25high) and light brown (Bin1high) (=indicates unchanged expression). All RT-qPCR data were normalized to Tbp and shown as mean ± SEM. *P < 0.05, **, ##P < 0.01, ***P < 0.001, ****P < 0.0001.
Source data are available for this figure.

