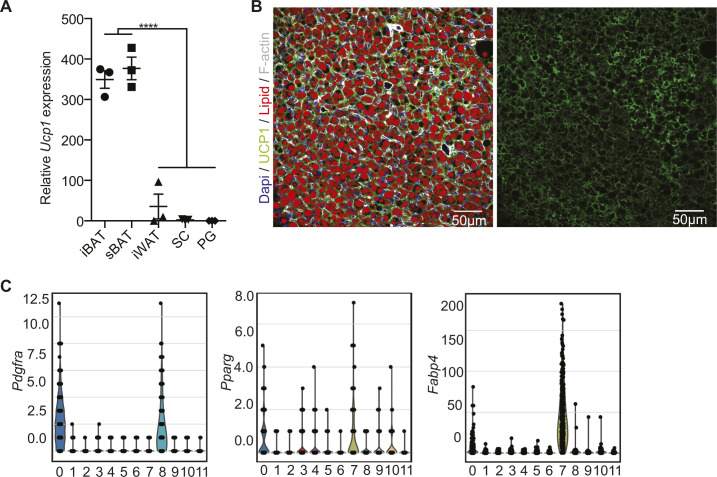
Figure S1. Expression of Ucp1 in adipose tissues and preadipocyte markers in the scRNAseq clusters of the SVF of BAT.
(A) Quantitative PCR analysis of Ucp1 expression in interscapular brown adipose tissue, subscapular BAT, interscapular white adipose tissue, subcutaneous fat (SC), and perigonadal fat (PG) from 6-wk-old C57BL/6 mice (n = 3; ***P < 0.001). Data are mean expressions normalized to Tbp ± SEM. (B) Representative immunofluorescence staining of UCP1 on BAT used for quantifications in Fig 1B (Dapi: blue, UCP1: green, lipid droplets: red, F-actin: gray). (C) Violin plots showing the distribution of selected marker genes (Pdgfra, Pparg, and Fabp4) across louvain cluster computed on all cell types identified in the single-cell RNA-seq data set.
Source data are available for this figure.

