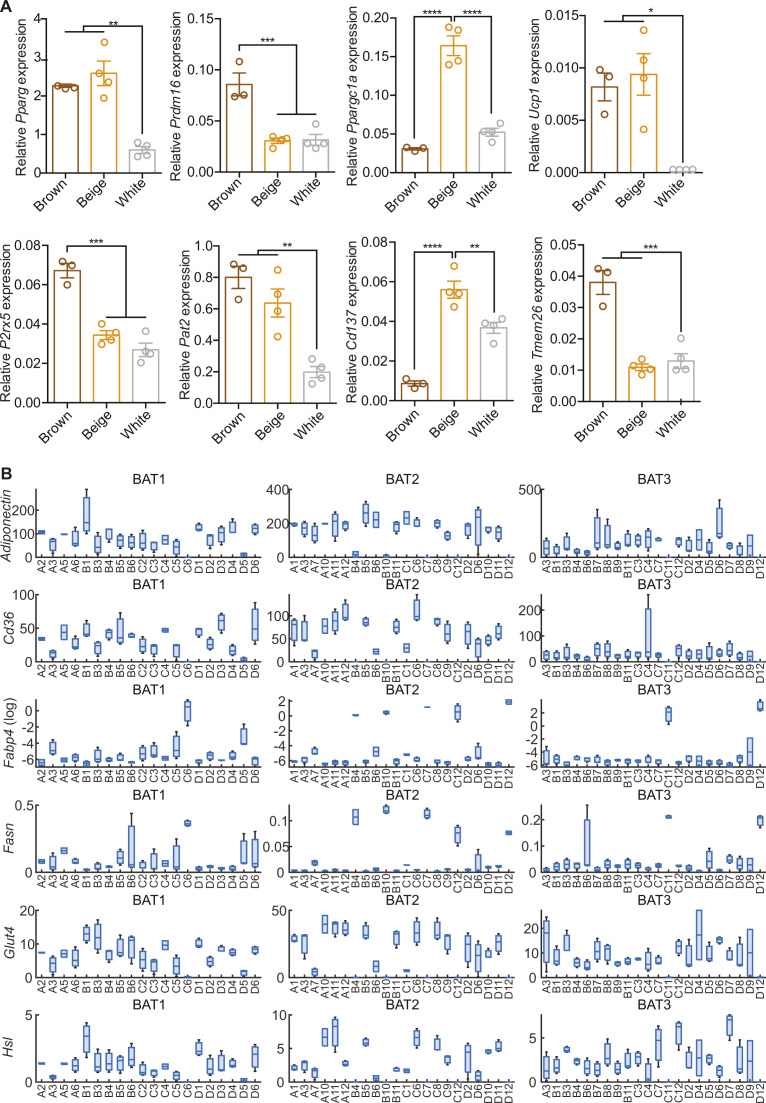
Figure S2. mRNA expression of brown and beige fat-specific markers in brown, beige and white adipocytes.
(A, B) qPCR analysis of (A) Pparg, Prdm16, Ppargc1a, Ucp1, P2rx5, Pat2, Cd137, and Tmem26 expression in brown, beige and white adipocytes (n = 3–4) and (B) Adiponectin, Cd36, Fabp4 (log), Fasn, Glut4, and Hsl expression in brown adipose tissue clones (n = 2–3). All qPCR data were normalized to Tbp and shown as mean ± SEM. (B) *P < 0.05, **, ##P < 0.01, ***P < 0.001, ****P < 0.0001.
Source data are available for this figure.

