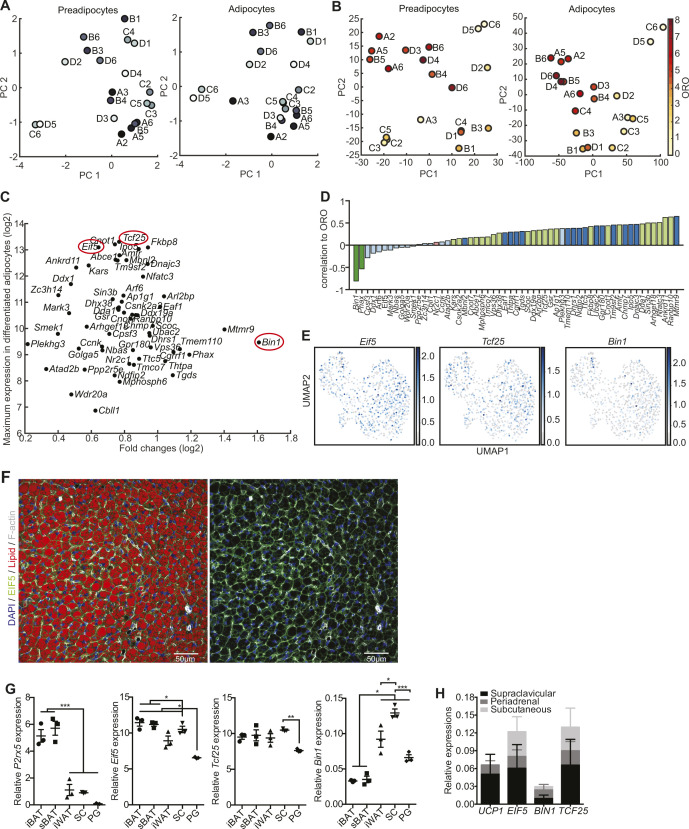
Figure S5. EIF5, TCF25 and BIN1 mark subpopulation in BAT and are differentially expressed in human fat depots.
(A, B) PCA plots of pre- (left panel) and differentiated (right panel) adipocytes (A) from stable expressed gene expression module genes and (B) color-coded clones based on the Oil Red O quantification. (C) Scatter plots of stable expressed genes with regards to their maximum expression in differentiated adipocytes and maximal log fold change (log2) between differentiated adipocyte clones. (D) Correlation coefficients for stably expressed genes compared to lipid content as measured by Oil Red O. Color of bars indicates module membership. (E) UMAP of all preadipocytes with Eif5, Tcf25, and Bin1 expression superimposed. The expression values shown are size factor normalized and log transformed. (F) Representative immunofluorescence staining of EIF5 on brown adipose tissue (BAT) sections (DAPI: blue, EIF5: green, lipid droplets: red, F-actin: gray). (G, H) mRNA expression of P2rx5, Eif5, Tcf25, and Bin1 in (G) interscapular BAT, subscapular BAT, interscapular white adipose tissue, SC, and PG of wild-type C57BL/6J mice as assessed by qPCR (n = 3, data are mean expression normalized to B2m ± SEM) *P < 0.05, **P < 0.01, ***P < 0.001 and (H) in supraclavicular, periadrenal, and subcutaneous adipose tissue biopsies from six human donors for ADR and SCLV, and five donors for SCT as assessed by RNAseq.
Source data are available for this figure.

