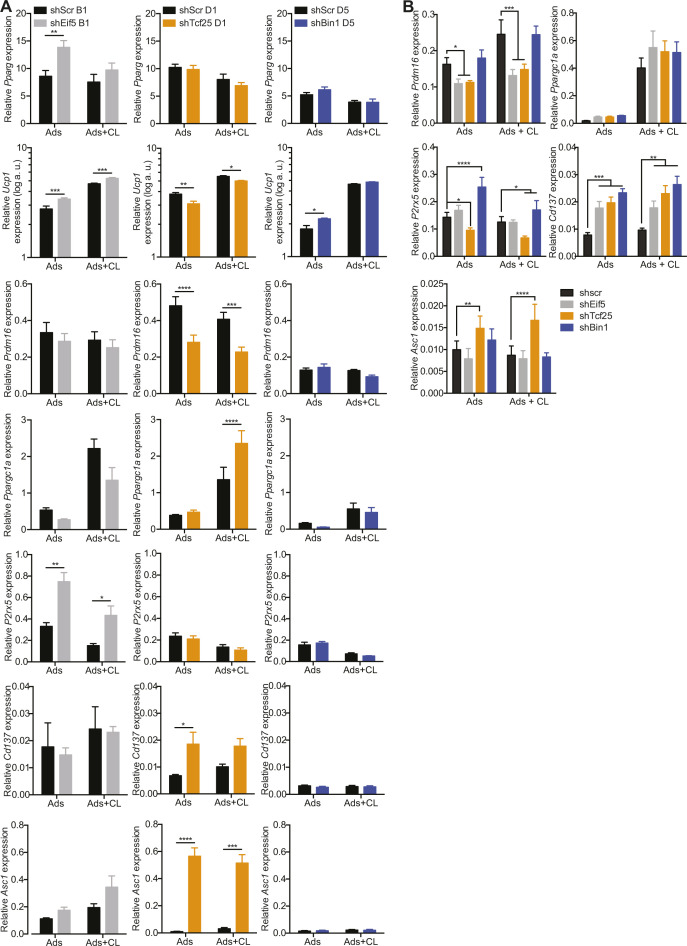
Figure S6. mRNA expression of brown, beige and white fat-specific markers in Eif5, Tcf25 and Bin1 knockdown clones and brown preadipocytes.
(A, B) Semi-quantitative PCR analysis of Pparg, Ucp1, Prdm16, Ppargc1a, P2rx5, Cd137, and Asc1 expression at day 8 of differentiation and 3 h treatment with 0.5 μM CL-316,243 in (A) shScr B1 and shEif5 B1 (left panel), shScr D1 and shTcf25 D1 (middle panel), shScr D5 and shBin1 D5 (right panel) cells (n = 5), and (B) shScr, shEif5, shTcf25, and shBin1 on mixed brown adipocytes cells (n = 6). Data are shown as mean expression normalized to Tbp ± SEM. *P < 0.05, **P < 0.01, ***P < 0.001, ****P < 0.0001.
Source data are available for this figure.

