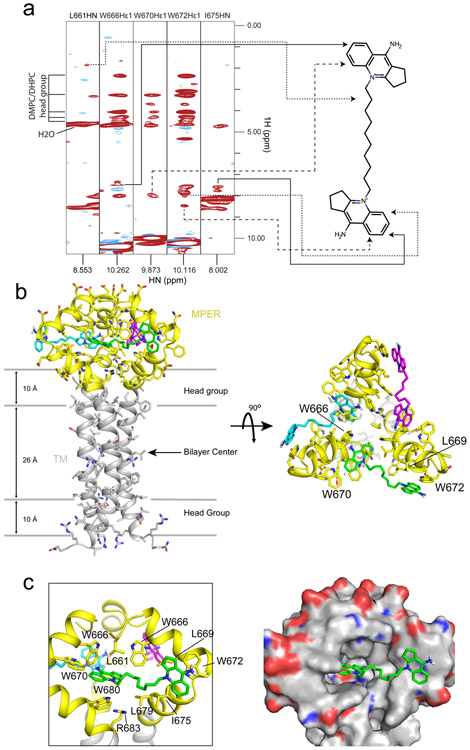
Figure 4. Structure of S2C3 in complex with the MPER-TMD.
(a) Strips from the 3D 15N-edited NOESY-TROSY-HSQC spectrum with J(13C-1H) modulation recorded using the 15N-, 13C-, 2H-labeled MPER-TMD protein (0.6 mM) in the presence of 2 mM S2C3. NOE peaks from the protons of S2C3 were observed in these strips and mapped to the S2C3 molecule on the right side as indicated by arrows. These NOE peaks were not observed in the spectrum of a control sample without S2C3 (Supplementary Fig. 11). The acyl chains of DHPC/DMPC in bicelles and the protein carbon side chains are deuterated. Solvent water shows a peak with a 1H chemical shift at ~4.7 ppm; protons of head groups of DMPC/DHPC bicelles give peaks with chemical shifts at 2.2-4.2 ppm. (b) Top and side views of the NMR structure of the S2C3-MPER complex. 15 structures with the lowest energies were selected for the final ensemble from 100 structures generated by Xplor-NIH software56. The average structure of the ensemble is shown with protein backbone in ribbon diagram and side chains in stick model. The lipid bilayer is indicated by gray lines schematically. The MPER is colored in yellow and the TMD in gray. Three S2C3 molecules occupying three binding pockets in an MPER trimer are shown in magenta, cyan and green. (c) Close-up views of the hydrophobic binding pocket of S2C3 formed by residues in the MPER in ribbon diagram (left) and electrostatic potential surface representation (right; blue: positively charged and red: negatively charged), respectively.

