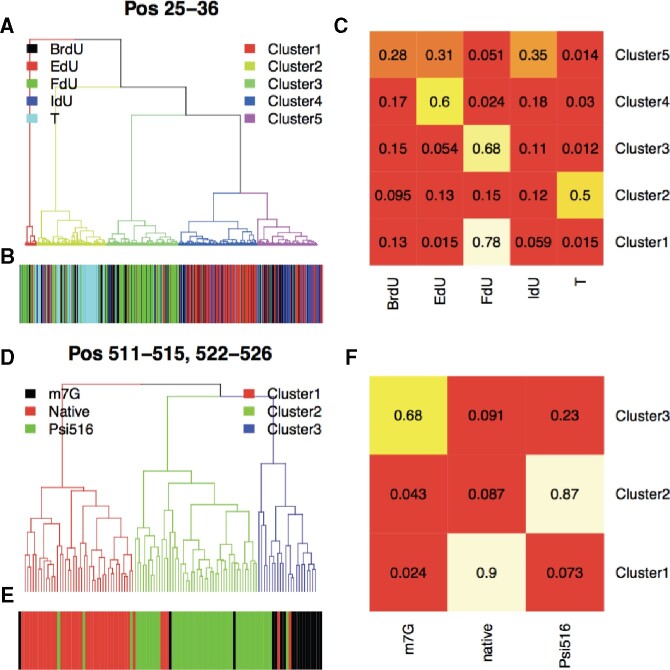
Fig. 4.
Inferring association between modifications by read-level analysis. (A) Hierarchical clustering analysis on primer extension reads covering reference position 25–36 (see Section 2). Branches of dendrogram were color-coded according to the cluster assignments. (B) Corresponding read annotation, including T- (cyan), IdU- (blue), FdU- (green), EdU- (red) and BrdU-containing reads (black). (C) Read composition of each cluster. (D) Hierarchical clustering analysis on 16S rRNA reads covering reference position 511–515 and 522–526 (see Section 2). Branches of dendrogram were color-coded according to the cluster assignments. ≪ Please note that the part figures mentioned in second occurrence in Figure 4 have been changed from ‘B and C’ to ‘E and F’ respectively. Kindly check and confirm.≫(E) Corresponding read annotation, including Psi516 (green), Native (red) and m7G reads (black). (F) Read composition of each cluster

