. 2020 Oct 28;9:e61312. doi: 10.7554/eLife.61312

Figure 2. Analysis of S-encoding sequences following rVSV/SARS-CoV-2/GFP replication in the presence of neutralizing monoclonal antibodies.

(A–D) Graphs depict the S codon position (X-axis) and the frequency of non-synonymous substitutions (Y-axis) following the second passage (p2) of rVSV/SARS-CoV-2/GFP on 293T/ACE2(B) cells in the absence of antibody or plasma (A), or in the presence of 10 μg/ml C121 (B), C135 (C) or C144 (D). Results are shown for both rVSV/SARS-CoV-2/GFP variants (One replicate each for rVSV/SARS-CoV-2/GFP1D7 and rVSV/SARS-CoV-2/GFP2E1 - the frequency of 1D7 mutations is plotted as circles and 2E1 mutations as triangles).

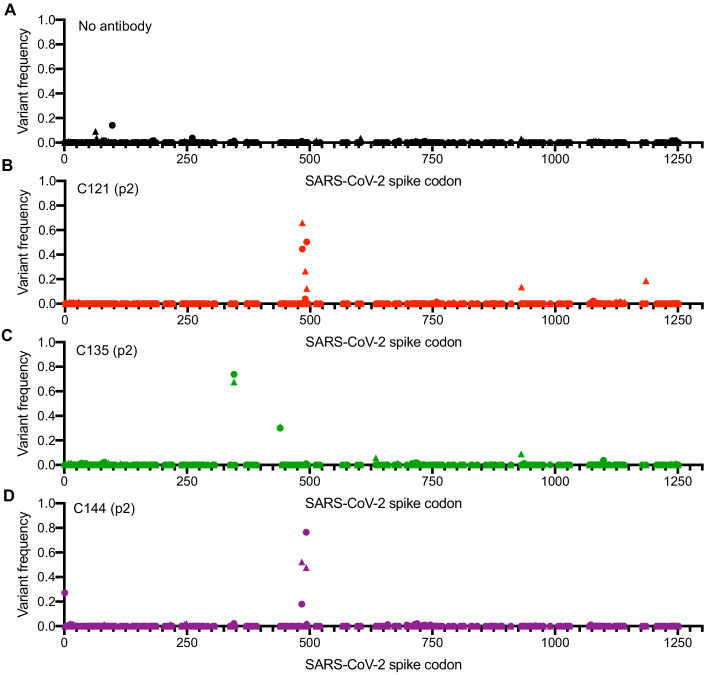
Figure 2.

Figure 2—figure supplement 1. Analysis of S-encoding sequences following rVSV/SARS-CoV-2/GFP replication in the presence of convalescent plasma COV-47 and COV-72.

Figure 2—figure supplement 1.

(A–B) Graphs depict the S codon position (X-axis) and the frequency of non-synonymous substitutions (Y-axis) following the second, third or fourth passage (p2–p4) of rVSV/SARS-CoV-2/GFP on 293T/ACE2(B) cells in the presence of COV-47 plasma (A), or COV-72 plasma (B). Results are shown for both rVSV/SARS-CoV-2/GFP variants (the frequency of 1D7 mutations is plotted as circles and 2E1 mutations as triangles).
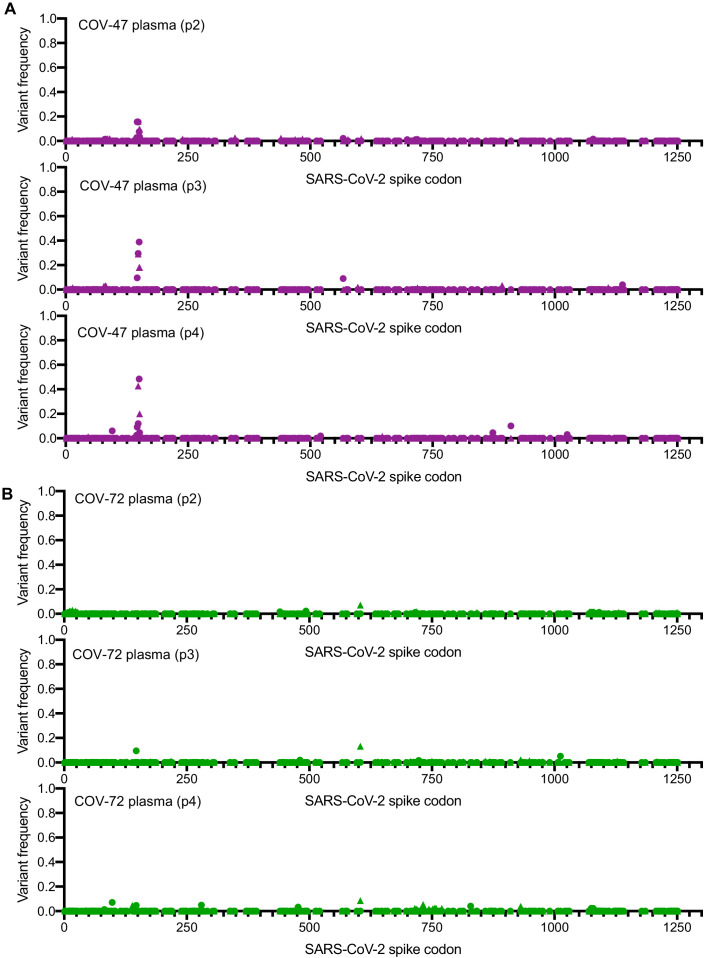
Figure 2—figure supplement 2. Analysis of S-encoding sequences following rVSV/SARS-CoV-2/GFP replication in the presence of convalescent plasma COV-107 and COV-NY.

Figure 2—figure supplement 2.

(A–B) Graphs depict the S codon position (X-axis) and the frequency of non-synonymous substitutions (Y-axis) following the second, third or fourth passage (p2–p4) of rVSV/SARS-CoV-2/GFP on 293T/ACE2(B) cells in the presence of COV-107 plasma (A), or second passage in the presence of COV-NY plasma (B). Results are shown for both rVSV/SARS-CoV-2/GFP variants (the frequency of 1D7 mutations is plotted as circles and 2E1 mutations as triangles).