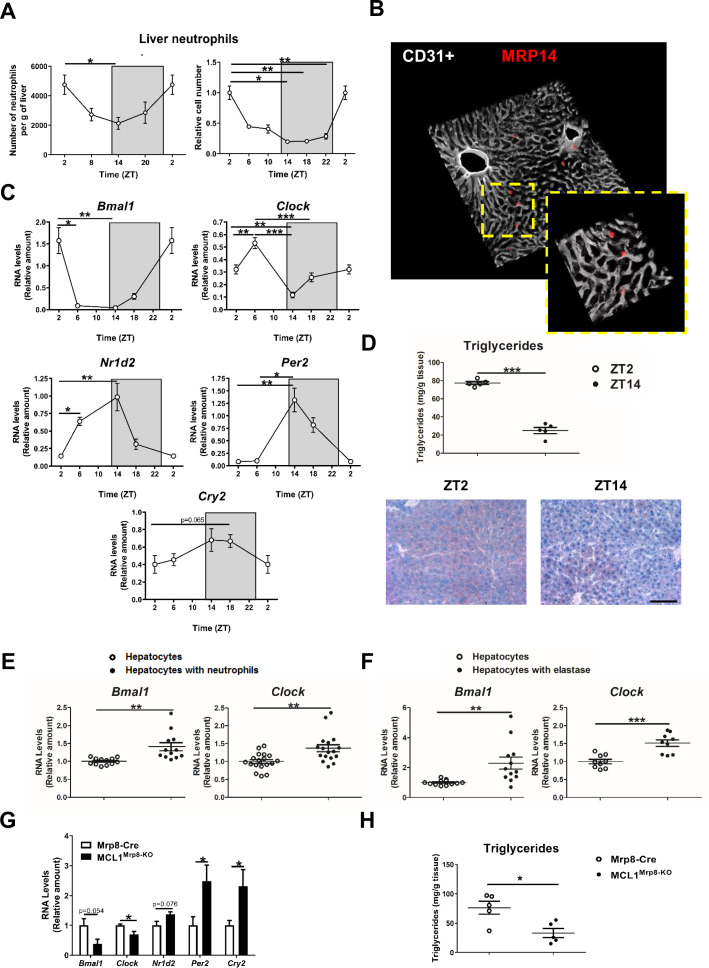
Figure 1. Neutrophil infiltration into the liver controls hepatic clock-gene expression.
(A) Flow cytometry analysis of the CD11b+Ly6G+ liver myeloid subset, isolated from C57BL6J mice at the indicated ZTs. Left, CD11b+Ly6G+ liver myeloid subset analyzed at 6 hr intervals and normalized by the tissue weight. Right, percentage of CD11b+Ly6G+ population analyzed at 4 hr intervals and normalized to ZT2 (n = 5). (B) Representative 3-D image of liver section showing the distribution on infiltrated neutrophils. Livers were stained with anti-S100A9 (Mrp14) (red) and vessels were stained with anti-CD31 and anti-endomucin (grey). Sizes of the liver sections are 510 x 510 x 28 µm and 160 x 160 x 28 µm, respectively. (C) qRT-PCR analysis of circadian clock-gene and nuclear-receptor mRNA expression in livers from C57BL6J mice at the indicated ZTs (n = 5). (D) Liver triglycerides and oil-red-stained liver sections prepared from C57BL6J mice at ZT2 and ZT14. Scale bar, 50 μm (n = 5). (E) qRT-PCR analysis of clock-gene mRNA in hepatocyte cultures exposed to freshly isolated FMLP-activated neutrophils (n = 4-6 wells of 3 independent experiments). (F) qRT-PCR analysis of clock-gene mRNA in hepatocyte cultures treated with 5 nM elastase (n = 3-4 wells of 3 independent experiments). (G) qRT-PCR analysis of clock-gene and nuclear-receptor mRNA expression in livers from control mice (Mrp8-Cre) and neutropenic mice (MCL1Mrp8-KO) sacrificed at ZT2 (n = 5). (H) Hepatic triglycerides detected in livers from control mice (Mrp8-Cre) and neutropenic mice (MCL1Mrp8-KO) at ZT2 (n = 5). Data are means ± SEM from at least 2 independent experiments. *p<0.05; **p<0.01; ***p<0.005 (A, left panel) One-way ANOVA with Tukey’s post hoc test. (A, right panel) Kruskal-Wallis test with Dunn’s post hoc test. (C) One-way ANOVA with Tukey’s post hoc test or Kruskal-Wallis test with Dunn’s post hoc test. (D to H) t-test or Welch’s test. ZT2 point is double plotted to facilitate viewing.


