. 2020 Dec 8;9:e59258. doi: 10.7554/eLife.59258

Figure 2. Increased hepatic neutrophil infiltration alters clock-genes expression and augments triglyceride content in the liver.

(A–D) Control (Lyzs-Cre) (A–B) and control and neutropenic (MCL1Lyzs-KO) mice (C–D) were housed for 3 weeks with a normal 12 hr: 12 hr light/dark cycle (Normal Cycle) or with the dark period extended by 12 hr every 5 days (JetLag). Samples were obtained at the indicated ZTs. (A) Left, flow cytometry analysis of the CD11b+Ly6G+ liver myeloid subset. Data represents the percentage CD11b+Ly6G+ normalized to Normal Cycle ZT2. Right, circulating neutrophils in whole blood. (n = 5-8). (B) Liver triglycerides and representative oil-red-stained liver sections at ZT14. Scale bar, 50 μm (n = 9-10). (C) Hepatic triglyceride content analyzed at 6 hr intervals, and representative oil-red-stained liver sections at ZT14. Scale bar, 50 μm (n = 4-6). (D) qRT-PCR analysis of Bmal1 mRNA in livers. (n = 5-8). (E) Flow cytometry analysis of the CD11b+Ly6G+ liver myeloid subset isolated at 6 hr intervals from C57BL6J mice fed a ND, a HFD (8 weeks) or a MCD (3 weeks). The chart shows the CD11b+Ly6G+ population as a percentage of the total intrahepatic CD11b+ leukocyte population normalized to ND group at ZT2 (n = 5 to 10). (F–I) Control mice (Lyzs-Cre) and neutropenic mice (MCL1Lyzs-KO) or p38γ/δLyzs-KO were fed a ND or the MCD diet for 3 weeks and sacrificed at ZT2. (F) Representative images of the infiltration of neutrophils in the liver stained with anti-Mrp14 (blue) and anti-NE (red); nuclei with Sytox Green. Scale bar, 50 μm (Top) and 25 μm (Bottom). (G) qRT-PCR analysis of clock-gene expression in livers (n = 6). (H) Liver triglycerides and representative oil-red-stained liver sections. Scale bar, 50 μm (n = 7-6). (I) qRT-PCR analysis of clock genes in livers at ZT2 (n = 9-17). Data are means ± SEM from at least two independent experiments. *p<0.05; **p<0.01; ***p<0.005 (A to D) t-test or Welch’s test. (E) Two-way ANOVA with Fisher’s post hoc test; p<0.05 ND vs HFD; p<0.0001 ND vs MCD. *p<0.05; ***p<0.005 (G to I) t-test or Welch’s test. ZT2 point is double plotted to facilitate viewing.

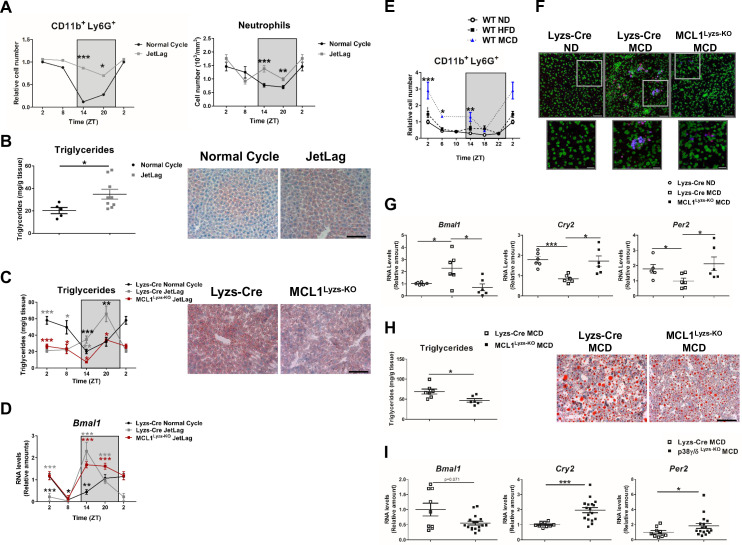
Figure 2—source data 1. Raw data and statistical test.

Figure 2.

Figure 2—figure supplement 1. Defective neutrophil migration to the liver alters hepatic clock- gene expression and triglyceride content.

Figure 2—figure supplement 1.

(A) Schematic representation of JetLag protocol with stepwise increases in the dark period of 12 h12h every 5 days (B) Flow cytometry analysis of the CD11b+Ly6G+ liver myeloid subset isolated from control (Lyzs-Cre) and neutropenic (MCL1Lyzs-KO) mice housed for 3 weeks under a 12 hr:12 hr light/dark cycle (Normal Cycle) or Jetlag. The bar chart shows the percentage of CD11b+Ly6G+ total intrahepatic CD11b+ leukocyte population analyzed at 6-h intervals and normalized to Normal Cycle ZT2 (n = 5-7). Dot plots show CD11b+ Ly6G+ population at ZT14. (C–D) After bone -marrow (BM) reconstitution of irradiated WT mice using Mrp8-Cre (Mrp8-Cre BM) or CXCR2Mrp8-KO (CXCR2Mrp8-KO) mice as BM donors, mice were housed for 3 weeks under JetLag (n = 6-8) (C) qRT-PCR analysis of Bmal1 mRNA in livers at ZT14. (D) Hepatic triglyceride content and representative oil-red-stained liver sections at ZT14. Scale bar, 50 µm. (E–G) Control (Lyzs-Cre) and p38γ/δLyzs-KO mice were housed for 3 weeks under JetLag (n = 6-7) (E) Flow cytometry analysis of the CD11b+ Ly6G+ liver myeloid subset analyzed at 6 hr intervals and normalized by the tissue weight. (F) qRT-PCR analysis of Bmal1 mRNA in livers at ZT14. (G) Hepatic triglyceride content and representative oil-red-stained liver sections at ZT14. Scale bar, 50 µm. Data are means ± SEM. *p<0.05; **p< 0.01; ***p<0.005 All tests are t-test or Welch’s test. ZT2 point is double plotted to facilitate viewing.
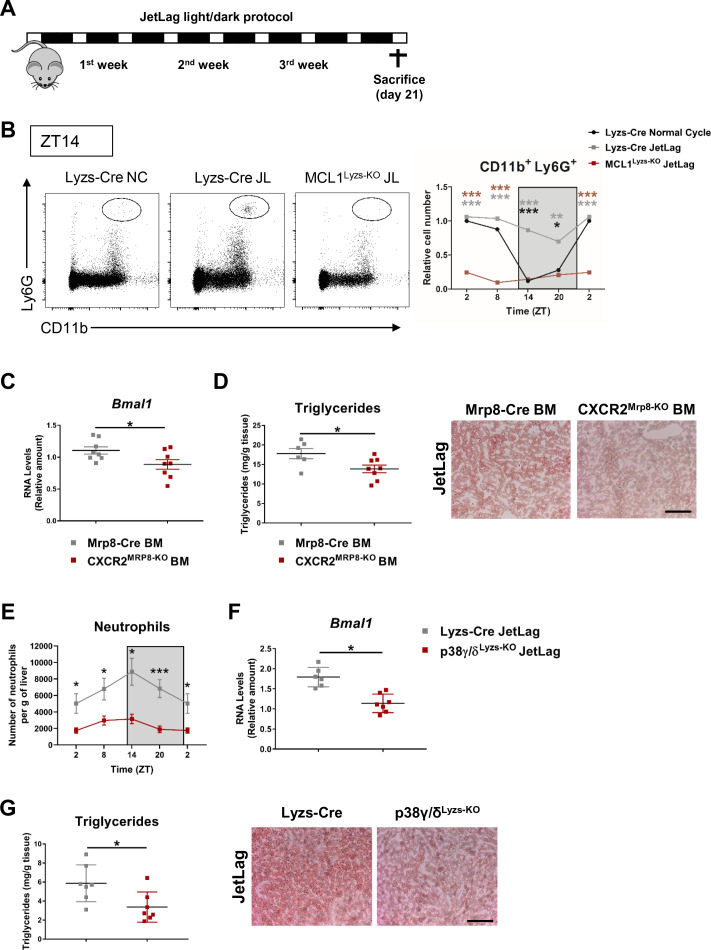
Figure 2—figure supplement 1—source data 1. Raw data and statistical test.
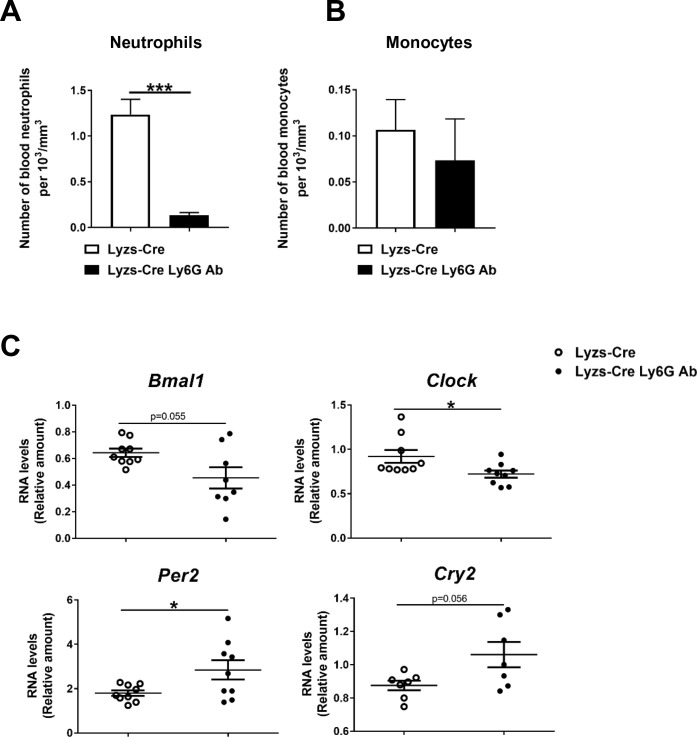
Figure 2—figure supplement 2. Neutrophil depletion alters hepatic clock-gene expression.

Figure 2—figure supplement 2.

(A-C) Osmotic minipumps containing saline or Ly6G antibody were implanted subcutaneously in Lyzs-Cre mice. These animals were fed with a MCD diet for 3 weeks and sacrificed at ZT2. (A-B) Blood levels of neutrophils and monocytes in Lyzs-Cre after 3 weeks of MCD diet treated or not with Ly6G antibody. (C) qRT-PCR of clock genes in the liver (n = 7-9). Data are means ± SEM. *p<0.05; ***p<0.005. All tests are t-test or Welch’s test.
Figure 2—figure supplement 2—source data 1. Raw data and statistical test.
Figure 2—figure supplement 2—source data 2. Raw data and statistical test.