. 2020 Nov 30;9:e62772. doi: 10.7554/eLife.62772

Figure 3. Cryo-EM density and structure of the pore.

Cryo-EM density is displayed as semitransparent surface, showing the M1 through M2 portions of the channel from two opposing subunits (M3–M4 and other subunits are omitted for clarity). The atomic model is shown in cartoon representation, with amino acid side chains drawn as sticks. Amino acid side chains on M1 and on the M1–M2 turret that face the ion conduction pathway have yellow colored carbon atoms. Nitrogen and oxygen atoms are colored dark blue and red, respectively. Regions of the pore are indicated.

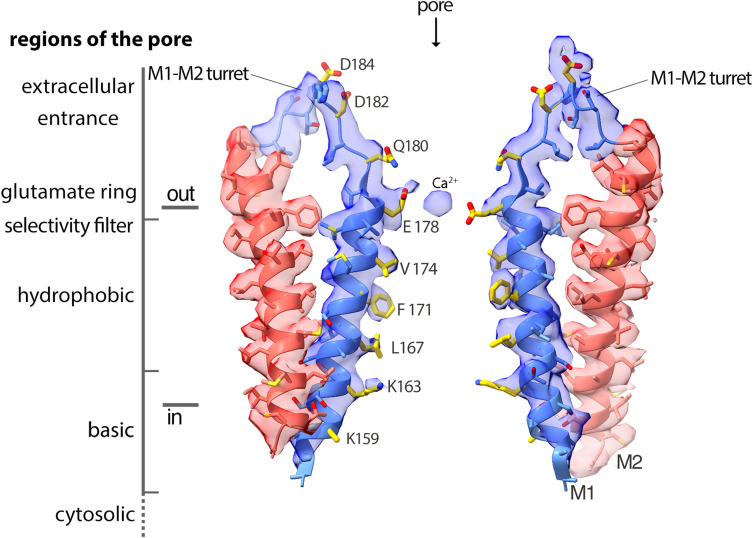
Figure 3.

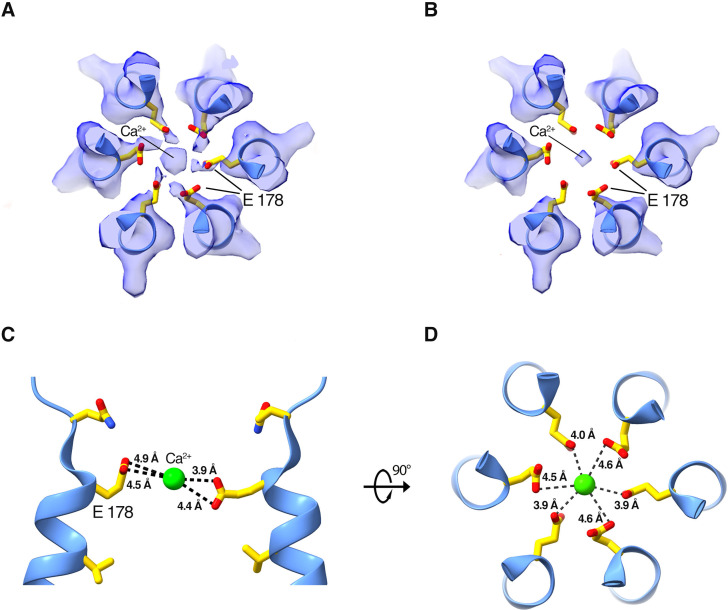
Figure 3—figure supplement 1. Density and approximate dimensions of the selectivity filter.

Figure 3—figure supplement 1.

(A and B) Cryo-EM density of the selectivity filter region, viewed from the extracellular side. Density is displayed as a semitransparent surface at two contour levels: (0.4 in [A] and 0.6 in [B]). The six Glu 178 residues are displayed as sticks; M1 helices are shown as cartoons. (C and D) Side and top views showing distances between Ca2+ (green sphere) and the Glu 178 residues in the final model.