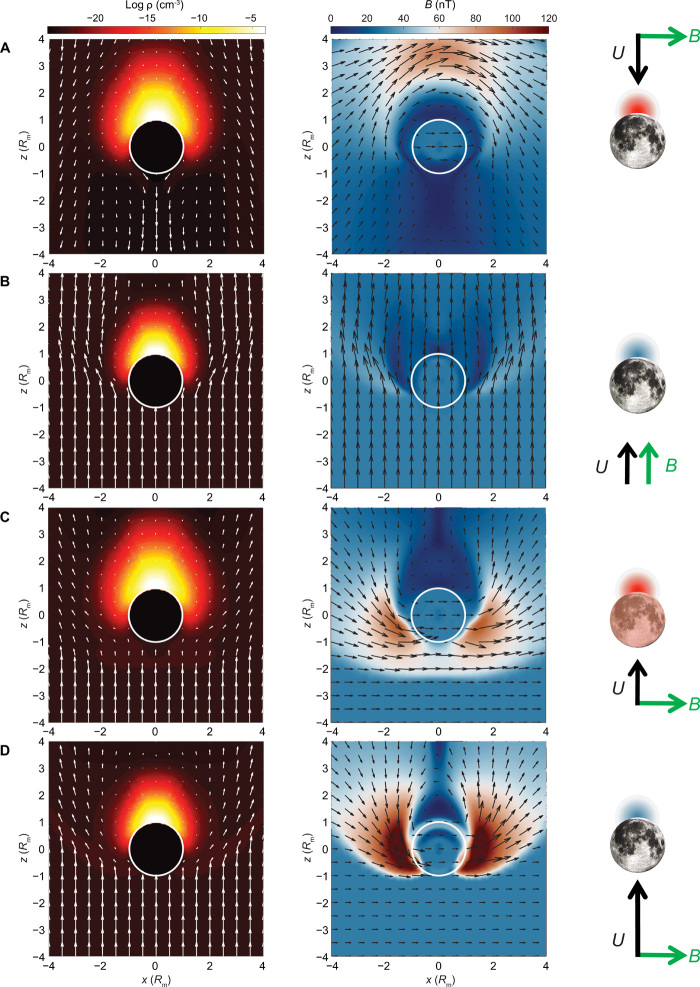
Fig. 3. Plasma flow and magnetic field evolution following four different impact scenarios (cases 2, 4, 6, and 7).
Snapshots from 50 s after launch of the vapor into the MHD simulations (table S1) are shown. Layout, color coding, and symbols are as in Fig. 1, except that the right column depicts the initial conditions, where U and B are the solar wind velocity and IMF direction, respectively. (A) Impact on upwind side (case 2). (B) IMF parallel to that of the solar wind flow (case 4). (C) Lunar crust and mantle with enhanced conductivities (case 6). (D) Colder vapor and faster wind (case 7).

