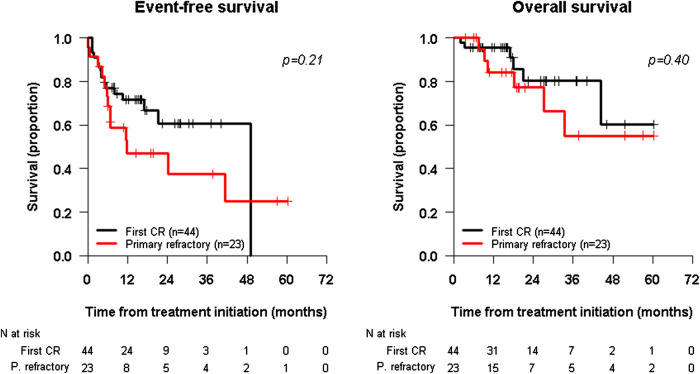
FIGURE 1.
Kaplan-Meier survival curves. EFS in the Left panel and OS in the Right panel. Survival curve for patients treated with anti-GD2 immunotherapy in first complete remission (CR) is depicted in Black Line and for patients treated with primary refractory disease to the osteomedullary (Bone/Bone Marrow) compartment is shown in Red Line. Survival curves are defined from the time of immunotherapy initiation.

