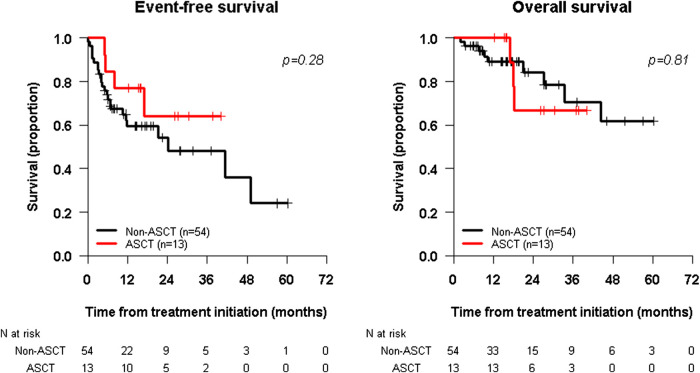
FIGURE 2.
Kaplan-Meier survival curves, EFS in the left panel and OS in the Right panel, for two subgroup of patients: those who received ASCT in their consolidation regimen (Red Line) and those who did not receive ASCT prior to immunotherapy (Black Line). Survival curves are defined from the time of immunotherapy initiation.

