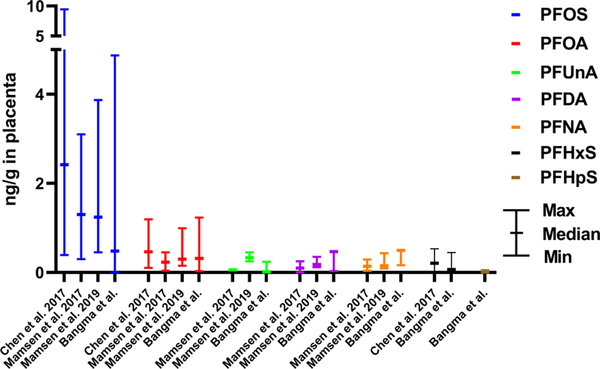
Figure 1.
Maximum, minimum, and median (means are indicated when medians were not reported in the literature) PFAS levels measured by ng/g wet weight in the human placenta as reported in the literature for Chen et al. 2017 (n = 32), Mamsen et al. 2019 (n = 78), Mamsen et al. 2017 (n = 34, means reported), and placentas included in the current study, Bangma et al. (n = 122). Frequently reported PFAS, including PFOS, PFOA, PFNA, and PFDA, were included in the graph as well as any additional PFAS detected in ~50% of the placenta in the current study, including PFUnA, PFHxS, and PFHpS.

