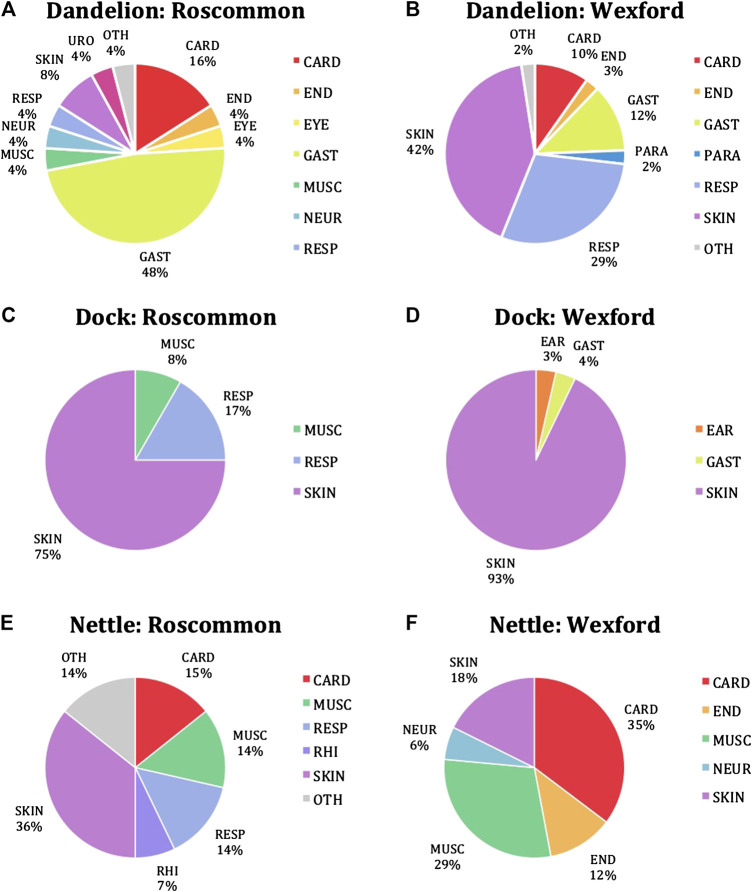
FIGURE 10.
Pie charts showing percentages of cited disease classes for treatment by (A,B) dandelion, (C,D) dock, and (E,F) nettle in Roscommon and Wexford. The disease classification system applied was that established by (Shannon et al., 2018). The pie charts were created using Microsoft Excel.

