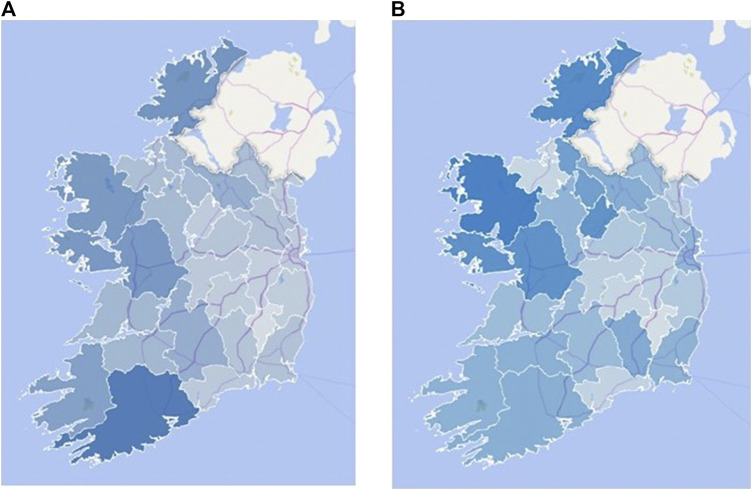
FIGURE 4.
Map graphs of Ireland (A) the number of digitalized manuscripts (42–488), (B) the number of retrieved transcripts citing the top 10 plants (139–848) in each county of the Republic of Ireland. The intensity of the blue scale correlates with the actual number of manuscripts. The graphs were created using the “3D Map” function of Microsoft Excel.

