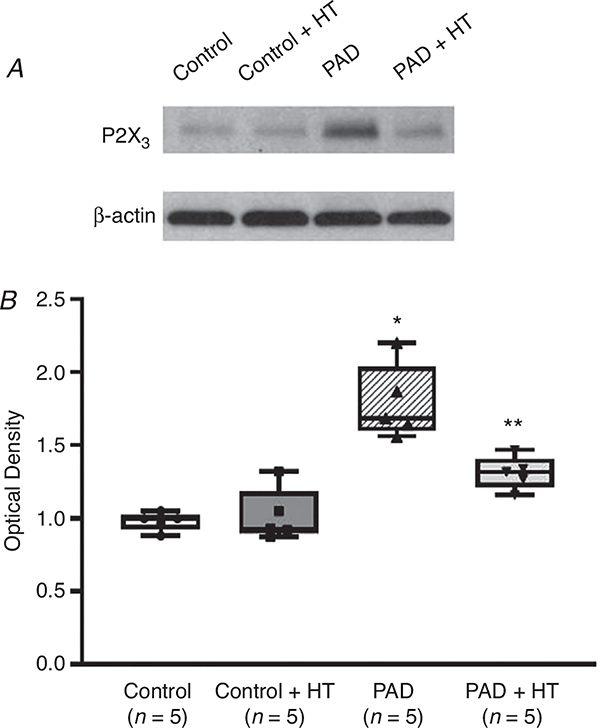
Figure 2. P2X3 protein expression in control, control + HT, PAD and PAD + HT rats.
The optical density of P2X3 receptor expression was normalized to that of the internal reference protein β-actin. Seventy-two hours of femoral artery ligation increased P2X3 protein expression in the L4–L6 DRGs of PAD rats compared with those of control rats (n = 5 in each group). Following HT, P2X3 protein expression was suppressed in PAD rats compared with PAD rats not exposed to HT (n = 5 in each group). Note that there was no significant difference in P2X3 receptor expression between control rats and control rats + HT (P > 0.05). *P < 0.05 vs. control rats; **P < 0.05 vs. PAD rats.

