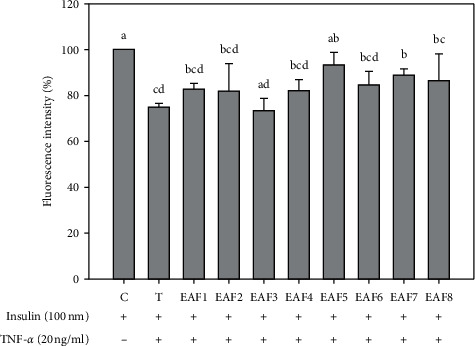
Figure 2.

Effects of RTL-EA fractions on glucose uptake in mouse FL83B hepatocytes. Each value is mean ± SD (n = 3). C (control): FL83B cells incubated with F-12K medium. T (TNF-α treatment): FL83B cells incubated with F-12K medium containing TNF-α (20 ng/ml) for 16 hours to induce insulin resistance. EAFs: TNF-α induced insulin resistance and then coincubated with RTL-EA fractions (25 µg/ml) for 30 min. ∗Significantly different from control (P < 0.05).
