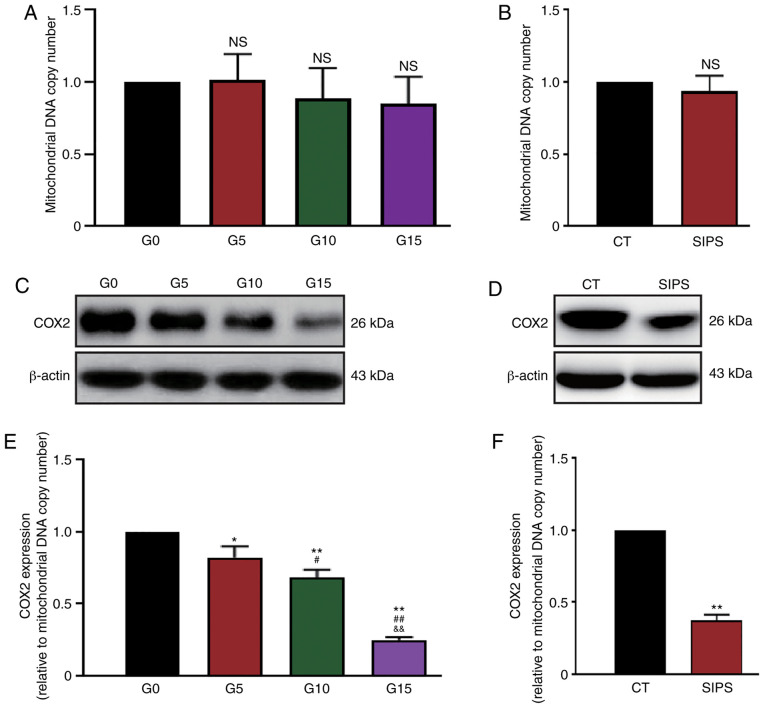
Figure 5.
Analysis of the COX2 protein expression. mtDNA copy numbers of the COX2 were detected by qPCR and protein quantities were detected by western blot analysis. The expression levels of COX2 were evaluated using the ratio between the gray value of blots and the mtDNA copy number. (A and B) Relative mtDNA copy numbers in RS and SIPS cells were not altered significantly. (C and D) COX2 protein quantity in the RS and SIPS models; (E and F) statistical analysis results indicating that the COX2 protein expression level decreased along with HMSC senescence. *P<0.05 and **P<0.01 as compared with the G0 or CT group; #P<0.05 and ##P<0.01 as compared with the G5 group; &&P<0.01 as compared with the G10 group. mtDNA, mitochondrial DNA; HMSCs, heart mesenchymal stem cells; RS, replicative senescence; SIPS, stress-induced premature senescence; COX2, cytochrome c oxidase subunit II.

