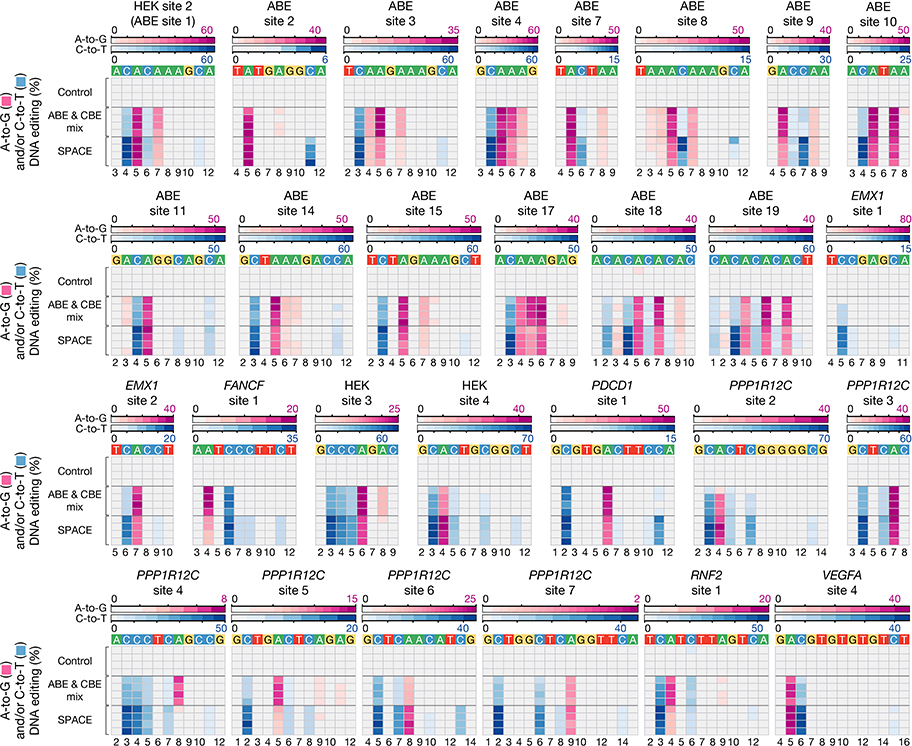
Extended Data Fig. 5: On-target DNA editing of SPACE compared to co-expression of miniABEmax-V82G and Target-AID (ABE & CBE mix) at 28 genomic sites.
Heat maps showing on-target DNA A-to-G (pink) and C-to-T (blue) editing frequencies induced by nCas9 (Control), co-expression of miniABEmax-V82G and Target-AID (ABE & CBE mix), or SPACE with 28 gRNAs (n=4 independent replicates). Editing windows shown represent the edited adenines and cytosines, not the entirety of the protospacer. Numbering at the bottom represents the position of the respective base in the protospacer sequence with 1 being the most PAM-distal location.

