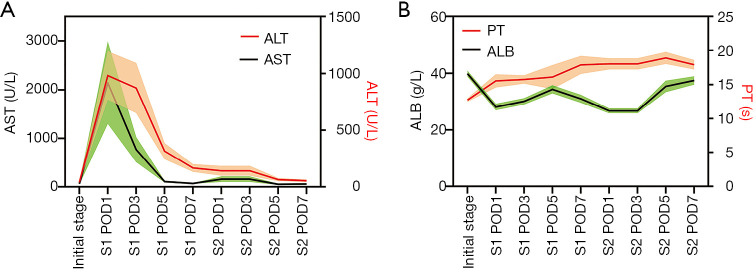
Figure 2.
Changes in laboratory findings after ALPPS procedures. (A) Dual Y-axes represented AST (black) on the left Y-axis and ALT (red) on the right. Green and orange areas indicated the error range. After the stage-1 operation, there were sharp increases and quick drops in AST and ALT. After the stage-2 operation, AST and ALT showed no inordinate increases and gradually returned to normal; (B) dual Y-axes represented ALB (black) on the left Y-axis and PT (red) on the right. Green and orange areas indicated the error range. ALB showed a marked fall in the first day after stage-1 and stage-2 operation, but steadily increased after that. PT rose from the first day after the stage-1 operation and had been at a relatively high level since then. ALPPS, associating liver partition and portal vein ligation for staged hepatectomy; AST, aspartate aminotransferase; ALT, alanine aminotransferase; ALB, albumin; PT, prothrombin time; S1, stage-1 operation; S2, stage-2 operation; POD, post-operative day.

