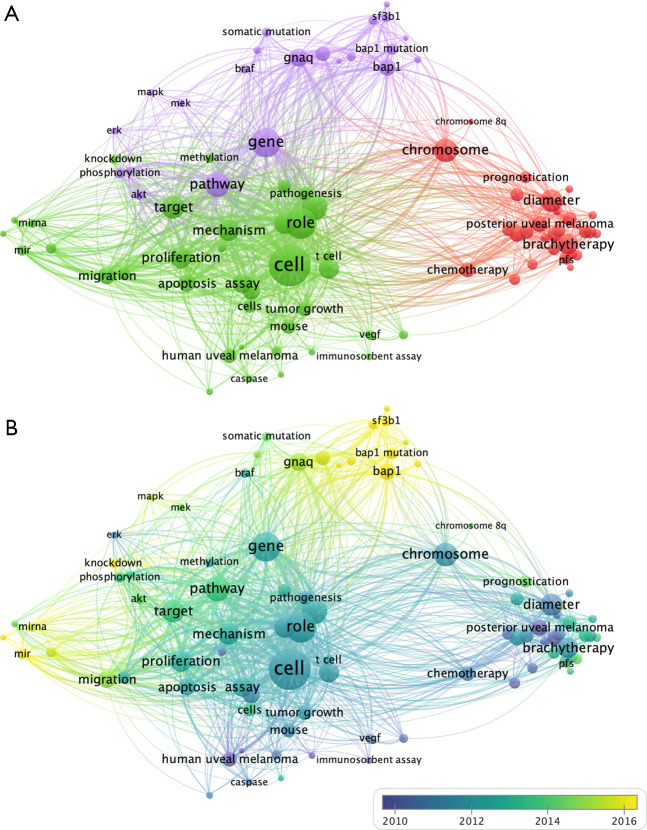
Figure 5.
The analysis of keywords in UM researches. (A) Mapping of the keywords in UM researches. All keywords were divided into three clusters and given different colors: tumor related research (left in green), clinical research (right in red), and gene mutation related research (up in purple). The circle with a large sizer represented a higher frequency of the keywords; (B) distribution of keywords based on the average time of appearance. Yellow indicates recent appearance, and blue indicates early appearance. Lines represent two keywords appearing in the same publication, thicker lines indicate closer relationships. UM, uveal melanoma.

