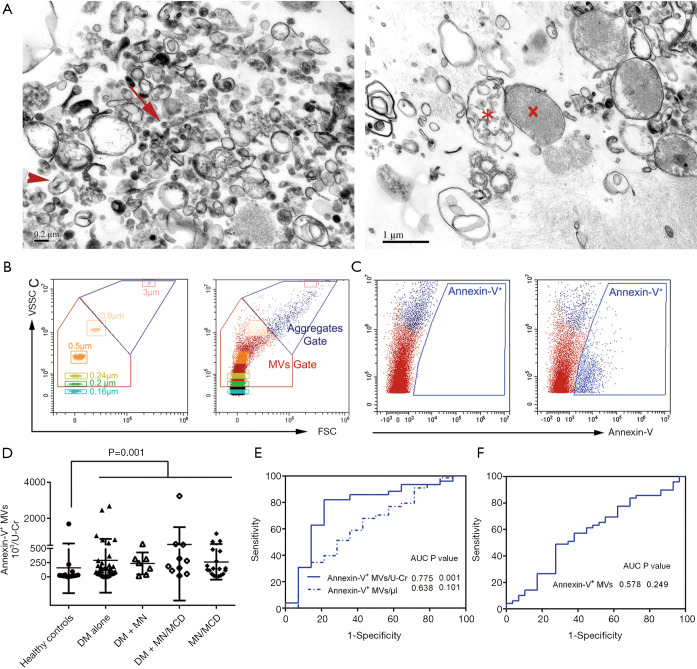
Figure 2.
Detection of urinary MVs. (A) Transmission electron micrographs of heterogenous extracellular vesicles fractions from the urine of a DN patient. The arrow indicates an exosome, the arrowhead indicates a MV, the X symbol indicates an apoptotic body and the asterisk indicates a migrasome. (B) Gates for MVs were determined by Megamix beads (left) first and applied in urine samples (right) on FSC/VSSC channel. (C) On FITC/VSSC channel, annexin-V+ MVs were identified, which is seen as a rightward shift. (D) The number of urinary annexin-V+ MVs in healthy subjects and patients. (E-F) ROC curves of annexin-V+ MVs to discriminate patients from healthy controls (E), and DN from patients (F). The corresponding AUCs for indicated biomarkers are also displayed in each panel. MVs, microvesicles; DN, diabetic nephropathy; DM, diabetic mellitus; MN, membranous nephropathy; MCD, minimal change disease; FSC, forward scatter; VSSC, violet side scatter; U-Cr, urinary creatinine; ROC, receiver operating characteristic; AUC, area under the curve.

