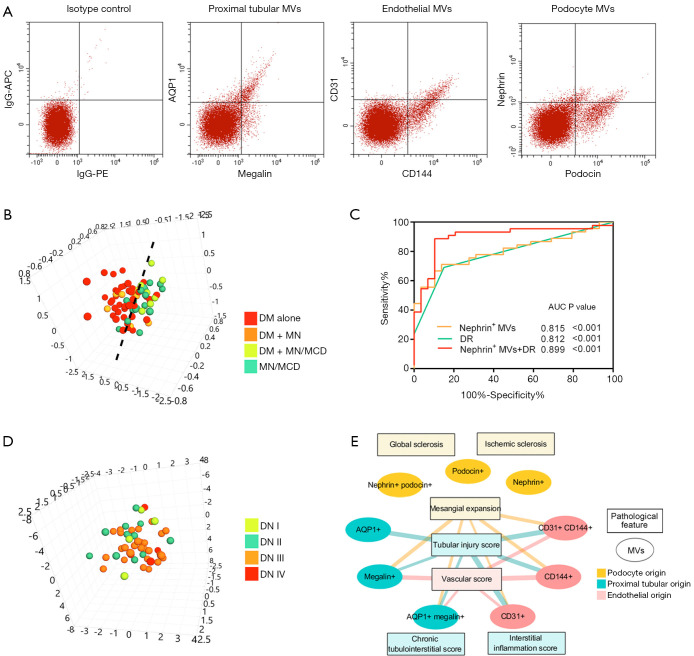
Figure 3.
Diagnostic value of urinary kidney MVs and their association with pathological features. (A) Representative traces from flow cytometry analysis of podocyte, proximal tubular and endothelial MVs. The isotype control was shown as APC-conjugated IgG versus PE-conjugated IgG. (B) PCA analysis showed that urinary MVs separated DN and proteinuric controls. (C) ROC curves of nephrin+ MVs, DR and their combination to discriminate patients from healthy controls. (D) PCA analysis showed that urinary MVs could hardly discriminate DN patients with different pathological classifications. (E) Correlations between the urinary MV populations and pathological features. Edge width reflects the value of Spearman’s correlation (range: 0.306–0.442, P<0.05). MVs, microvesicles; DN, diabetic nephropathy; AQP1, aquaporin 1; DM, diabetic mellitus; MN, membranous nephropathy; MCD, minimal change disease; ROC, Receiver-operating characteristic; AUC, area under the curve. PCA, principle component analysis.

