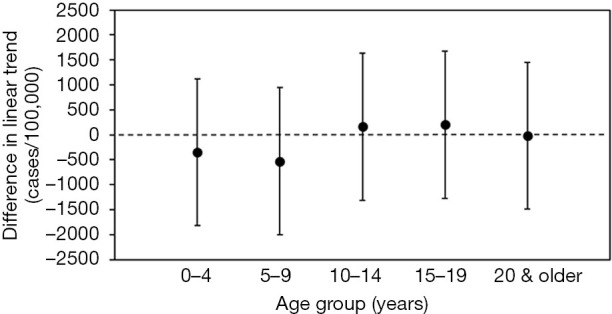
Figure 3.

Difference in the linear trend slopes between influenza and RSV infection during the pre-intervention period in Japan. The estimated difference contained the value zero within the 95% CIs for each age group, demonstrating a parallel trend between influenza and RSV during the pre- intervention period (2008/09–2011/12). Filled circles represent expected values, and whiskers extend to upper and lower 95% CIs. A difference at the value zero (dashed line) indicates that the assumed parallel trend is not rejected for each age group. RSV, respiratory syncytial virus; CI, confidence interval.
