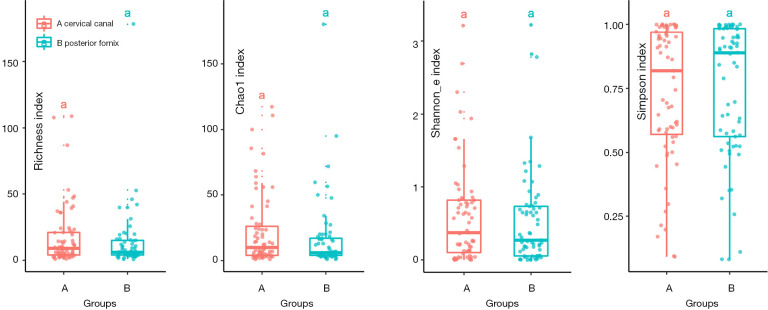
Figure 1.
Alpha diversity includes four indexes, Chao1, Richness, Shannon_e and Simpson index. Red is cervical canal (n=67), blue is posterior fornix (n=65). The same letters on the boxplot represent for statistical indifference (P<0.05; OTU, 97% cluster). Upper and lower edge of the box represent for first and third quartile, line in the box represent for median.

