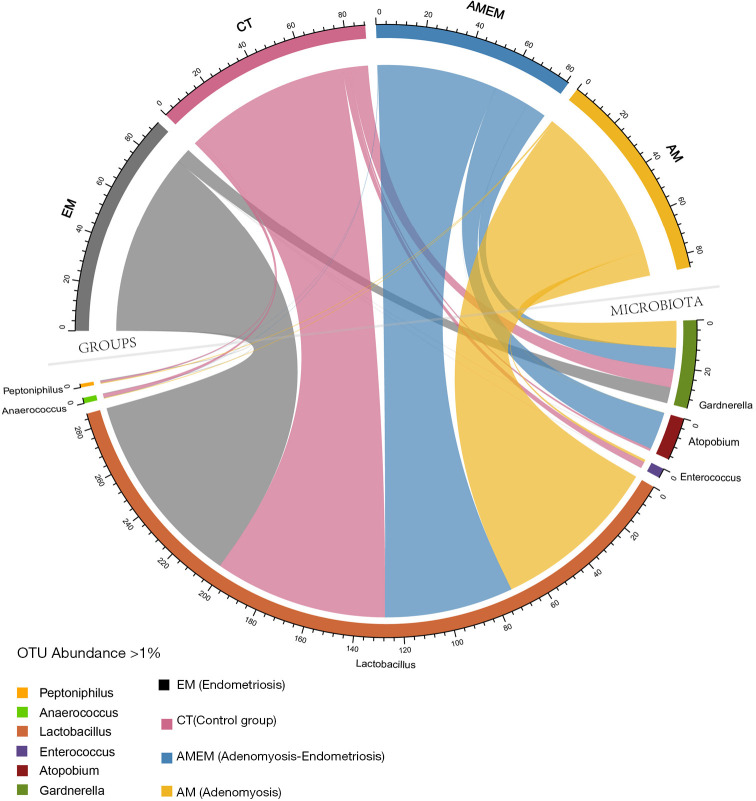
Figure 4.
With OTU abundance >1% selection (genus level), 6 OTUs were displayed in this figure. Upper half part of the circle shows four disease groups and the relative proportion of 6 OTUs. Lower half part of the circle shows the proportion taken by each disease group in each OTU. ASV, 100% cluster.

