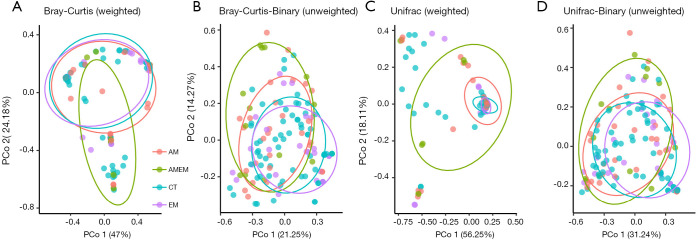
Figure 5.
PCoA plots were conducted in genus levels. Red dots represent AM, Green dots represent AMEM, blue dots represent CT and purple dots represent EM. Ellipse represent for 95% CI for each dots group. Four PCoA distances were analyzed. The percentage of X and Y axis represent for the degree of explanation of each dimension. Statistical difference is calculated by Adonis test. OTU, 97% cluster.

