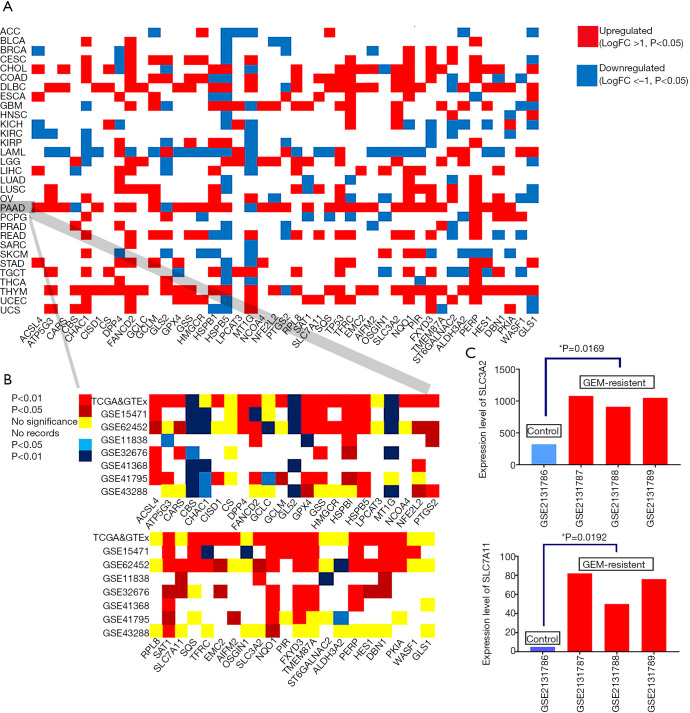
Figure 2.
Differential expression profiles of 43 ferroptosis regulators in cancer and normal samples. (A) The differential expression profiles of 43 ferroptosis regulators in 31 distinct cancer and normal samples. (B) The expression profiles of 43 ferroptosis regulators in seven Gene Expression Omnibus (GEO) cohorts were similar to the results in the The Cancer Genome Atlas (TCGA)/The Genotype-Tissue Expression (GTEx) cohort. (C) The expression levels of SLC3A2 and SLC7A11 were upregulated in gemcitabine-resistant pancreatic cancer cells.

