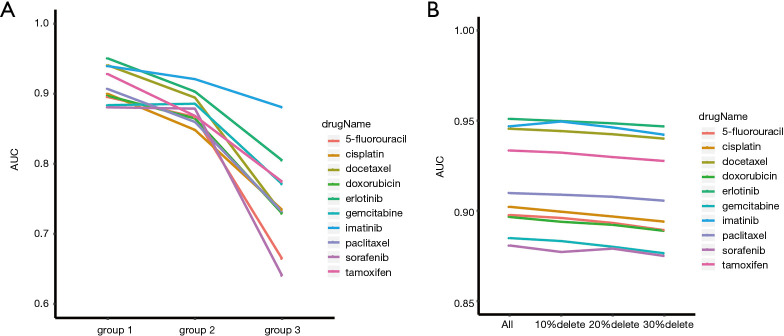
Figure 3.
Performance comparison of ncDRMarker. (A) Performance comparison of ncDRMarker with different seed nodes. The ordinate represents area under curve (AUC) values, abscissa represents different groups divided by seed nodes types. Group 1 represents ncRNA, group 2 represents ncRNA+mRNA, and group 3 represents mRNA. (B) Performance comparison of ncDRMarker with an incomplete network. The ordinate represents area under curve (AUC) values, abscissa represents the incomplete network that randomly deleted 10%, 20% and 30% of the regulatory relationships.

