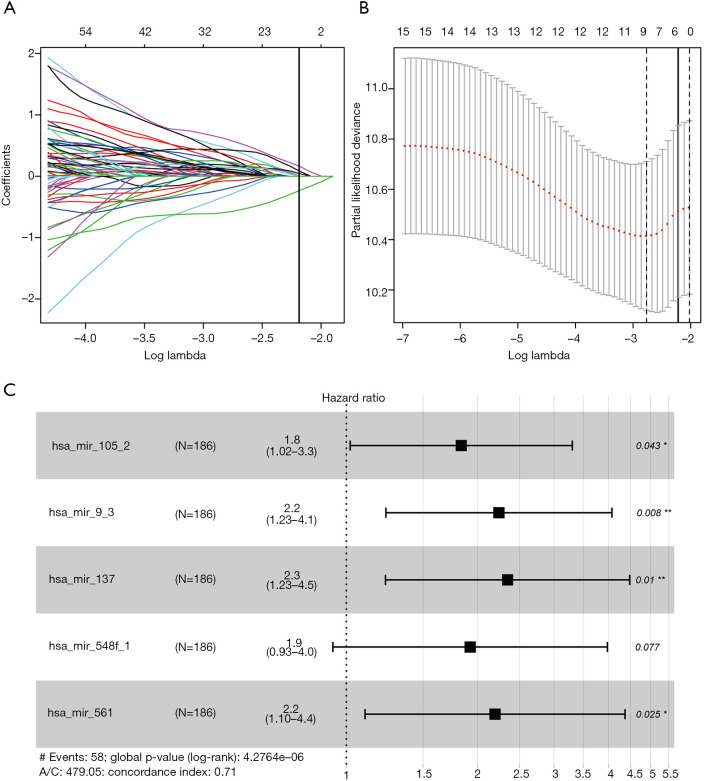
Figure 4.
A plots of regression coefficient diagram using the LASSO regression approach. (A) LASSO coefficient profiles of the fractions of significant DE miRNAs. Coefficient profiles decreased when the lambda value was enlarged. LASSO coefficient profiles of five miRNAs; a vertical solid line was plotted based on 10-fold cross-validation. (B) Cross-validation to tune parameter selection in the LASSO model. The vertical lines were plotted at optimal values by minimum criteria and one-standard error criteria. A vertical solid line represents the final five identified miRNAs. (C) Forest plots displaying the correlation of different miRNA subsets with OS in the training cohort. Unadjusted HRs are presented with 95% CI. *, P<0.05; **, P<0.01. HR, hazard ratio; CI, confidence interval; LASSO, least absolute shrinkage and selection operator.

