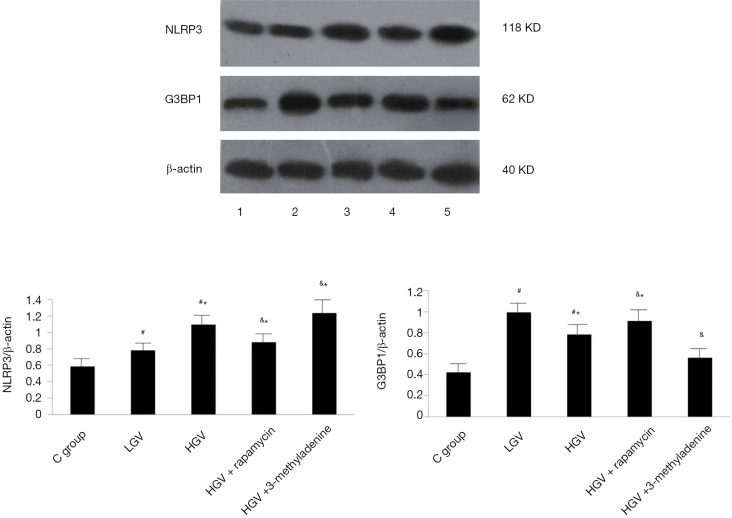
Figure 4.
Western blot analysis of NLRP3 and G3BP1 in the control group, low glycaemic variability group, high glycaemic variability group, high glycaemic variability + rapamycin group and high glycaemic variability + 3-methyladenine group. Comparisons were made in five groups (n=3 in each). *P<0.05 vs. sham group, #P<0.05 vs. LGV group, &P<0.05 vs. HGV group. The results were presented as the mean ± SD. Densities of bands were normalized to the β-actin.

