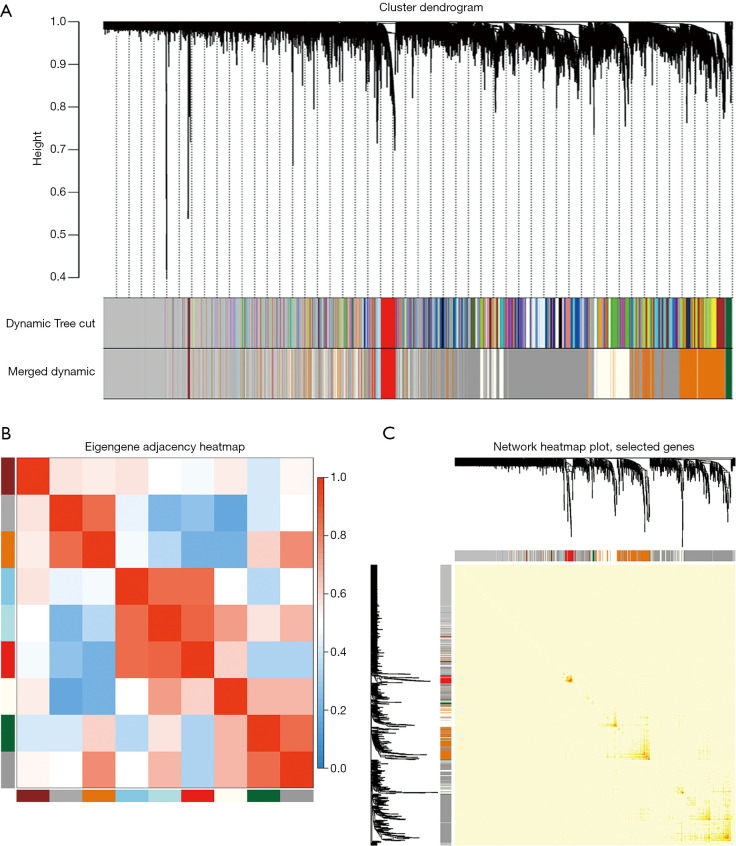
Figure 3.
Construction of the weighted gene co-expression network. (A) Cluster dendrogram. Each branch represents a module. The original and merged modules are respectively shown in the two colored bars below. (B) Eigengene adjacency heatmap. The colors of the squares from red to blue indicate the adjacency of the corresponding modules from high to low. (C) Heatmap plot of the selected genes. The colors from light to deep red represent a low to high interaction. The left and top of the figure show the gene dendrogram and module allocation.

