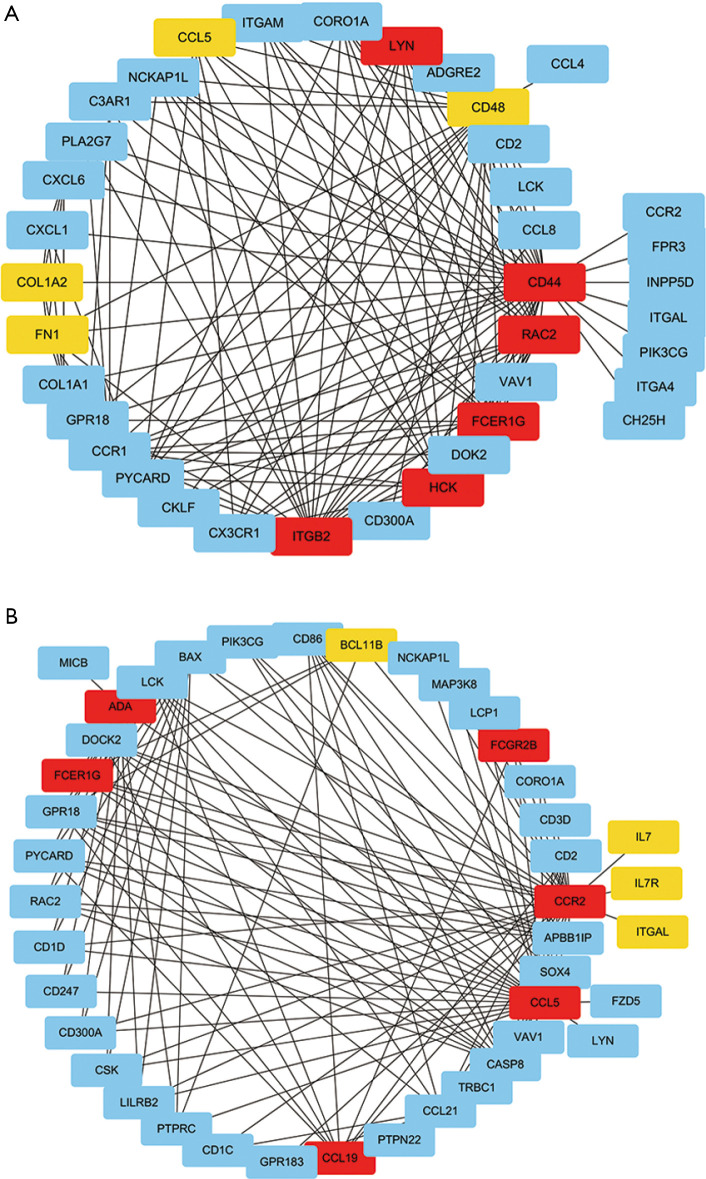
Figure 8.
Identification of the key gene associated with diabetic kidney disease (DKD). (A) Weighted gene co-expression network analysis (WGCNA) sub-network analysis of the leukocyte migration cluster in the darkorange2 module. Each node corresponds to a gene. Colors from yellow to red correspond to the top 10 maximal clique centrality (MCC) values from low to high. (B) WGCNA sub-network analysis of the T cell activation cluster in the darkorange2 module. The MCC value of FCER1G with red color was the largest in both sub-networks.

