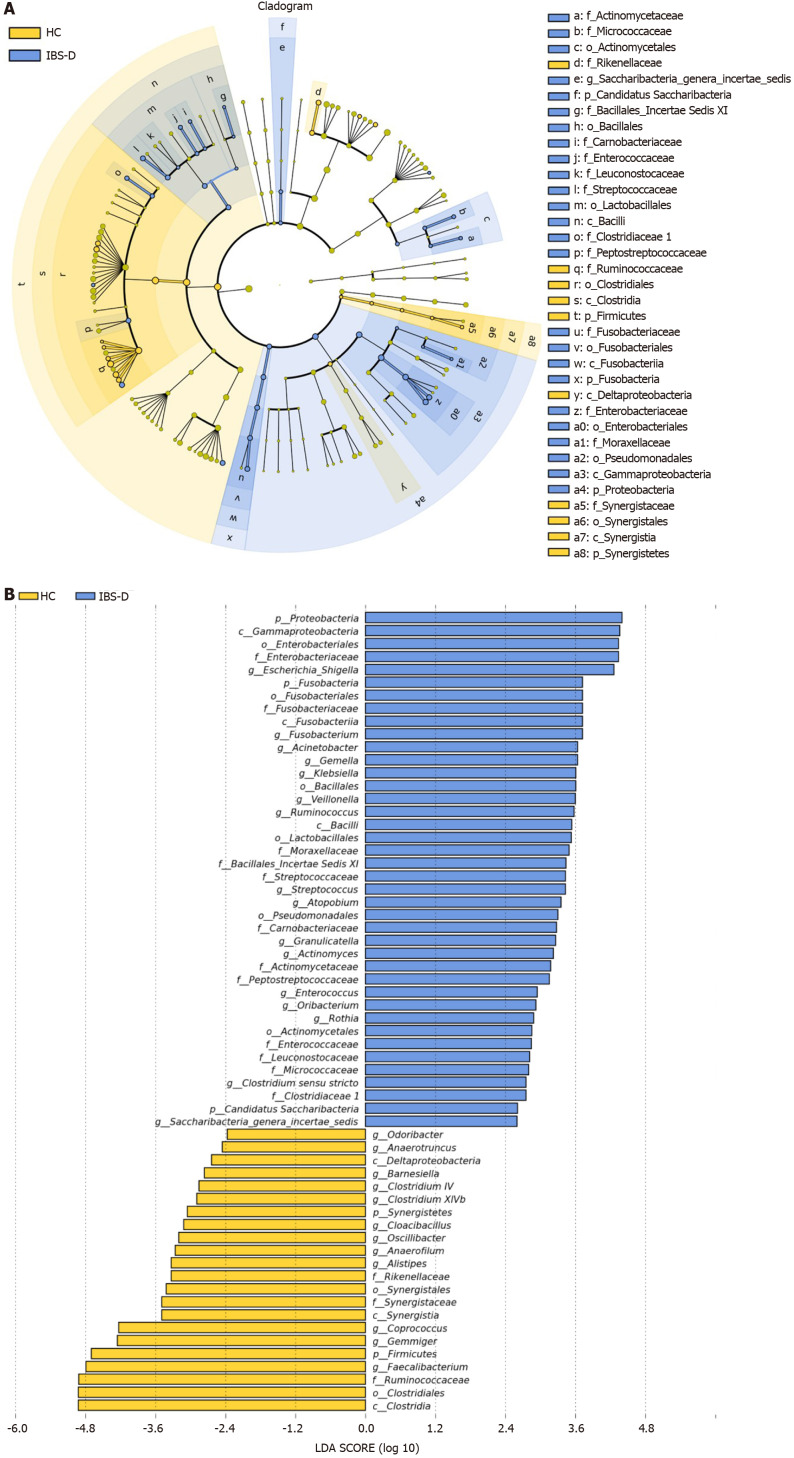
Figure 4.
Linear discriminant analysis effect size analysis of fecal bacterial of patients with diarrhea-predominant irritable bowel syndrome and healthy controls. A: The cladogram showed enriched taxa in the irritable bowel syndrome with predominant diarrhea (IBS-D) group (blue) and the healthy control (HC) group (yellow); the taxa represented by the English letters in the cladogram are shown in the legend on the right; B: Taxa enriched in the IBS-D group are indicated with a positive linear discriminant analysis (LDA) score (blue) and taxa enriched in the HC group are indicated with a negative score (yellow); only taxa with LDA effect size (LEfSe) P values < 0.05 and LDA scores ≥ 2.0 are presented.

