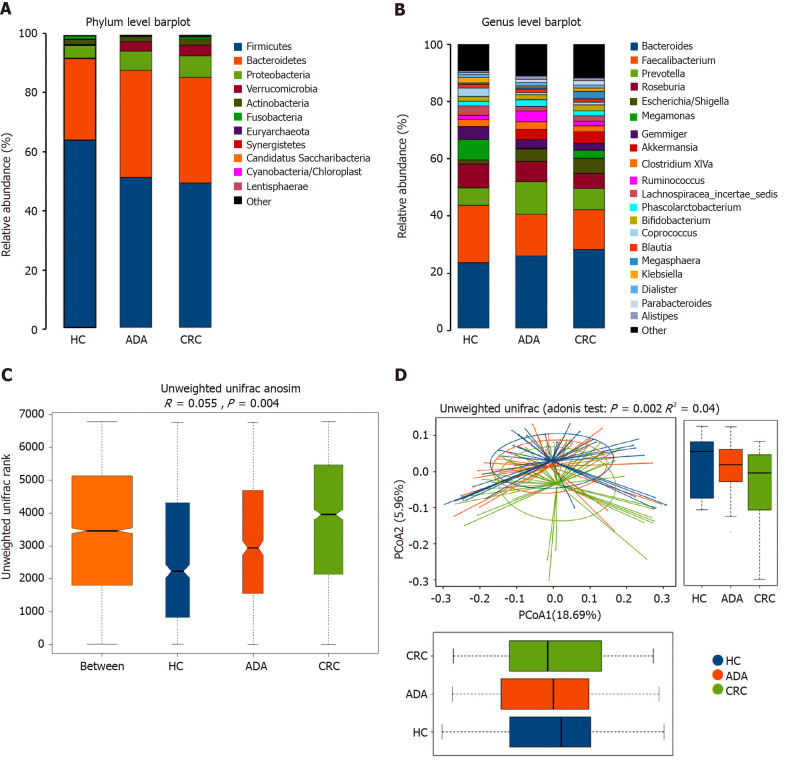
Figure 3.
Fecal bacterial structure of patients with colorectal adenoma, colorectal cancer, and healthy controls. A and B: Relative bacterial abundance of fecal bacterial at the phylum and genus levels in the three groups; C and D: Unweighted Unifrac (Anosim and Adonis) analysis of fecal bacterial in the patients and healthy control group (P < 0.05). Different colors represent different groups, and the distance between points indicates the degree of difference; boxes indicate the interquartile range; lines inside the boxes indicate the medians; the two whiskers indicate the maximum and minimum of the data; the points outside the box indicate outliers. HC: Healthy control; ADA: Colorectal adenoma; CRC: Colorectal cancer.

