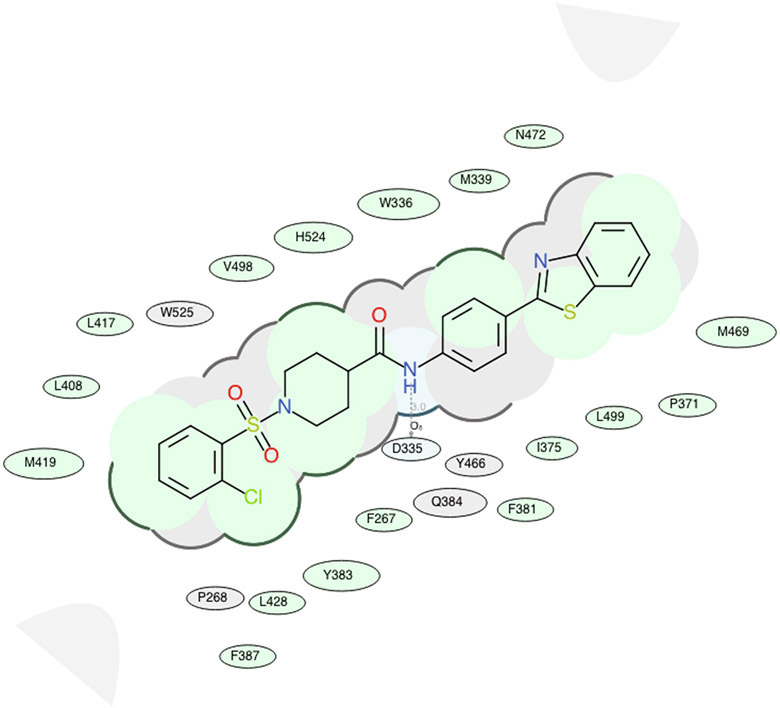
Fig. 6B.
2D representation for the lowest energy conformation of inhibitor 4–5 in the binding pocket of human sEH. Green shading represents hydrophobic region; gray parabolas represent accessible surface for large areas; broken thick line around ligand shape indicates accessible surface; size of residue ellipse represents the strength of the contact.

