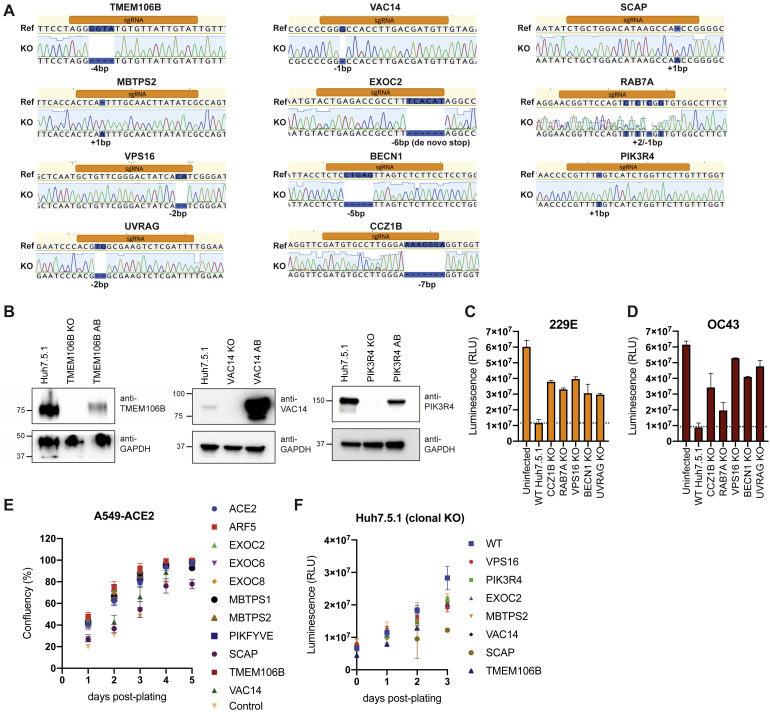
Figure S4.
Characterization of Gene-Edited Cells, Related to Figure 3
(A) Genotyping of clonal Huh7.5.1. Targeted loci were PCR-amplified, Sanger-sequenced and aligned to WT reference sequence. Frameshifts are highlighted in blue.
(B) Western blot analysis of WT, KO and KO cells with respective cDNA add-backs (AB) for TMEM106B, VAC14 and PIK3R4. Lysates to probe for TMEM106B were prepared under non-reducing conditions and bands appear as dimers. GAPDH was used as loading control.
(C) Cell viability measurement of 229E infected WT and KO Huh7.5.1 cells. Cells were infected with 229E (moi = 0.05) and viability was determined 8 dpi using Cell Titer Glo. Values are displayed as means ± SD from three biological samples.
(D) Cell viability measurement of OC43 infected WT and KO Huh7.5.1 cells. Cells were infected with OC43 (moi = 3) and viability was determined 8 dpi using Cell Titer Glo. Values are displayed as means ± SD from two biological samples.
(E) Analysis of cell proliferation of RNP-edited A549-ACE2 cells. Cells were plated in 96-wells and confluency was measured daily using an automated microscope. Values are displayed as means ± SD from four separate wells per cell line.
(F) Analysis of cell proliferation of WT and clonal KO Huh7.5.1 cells. Cells were plated in 96-wells and cell proliferation was measured daily using Cell Titer Glo. Values are displayed as means ± SD from three separate wells per cell line per time point.

